This tool is available to premium subscribers only.
This tool calculates inhibitor depletion and days remaining.
To access and use the Milbros Styrene Monomer Temperature Log and Inhibitor Depletion Tool, please follow these easy instructions.
-
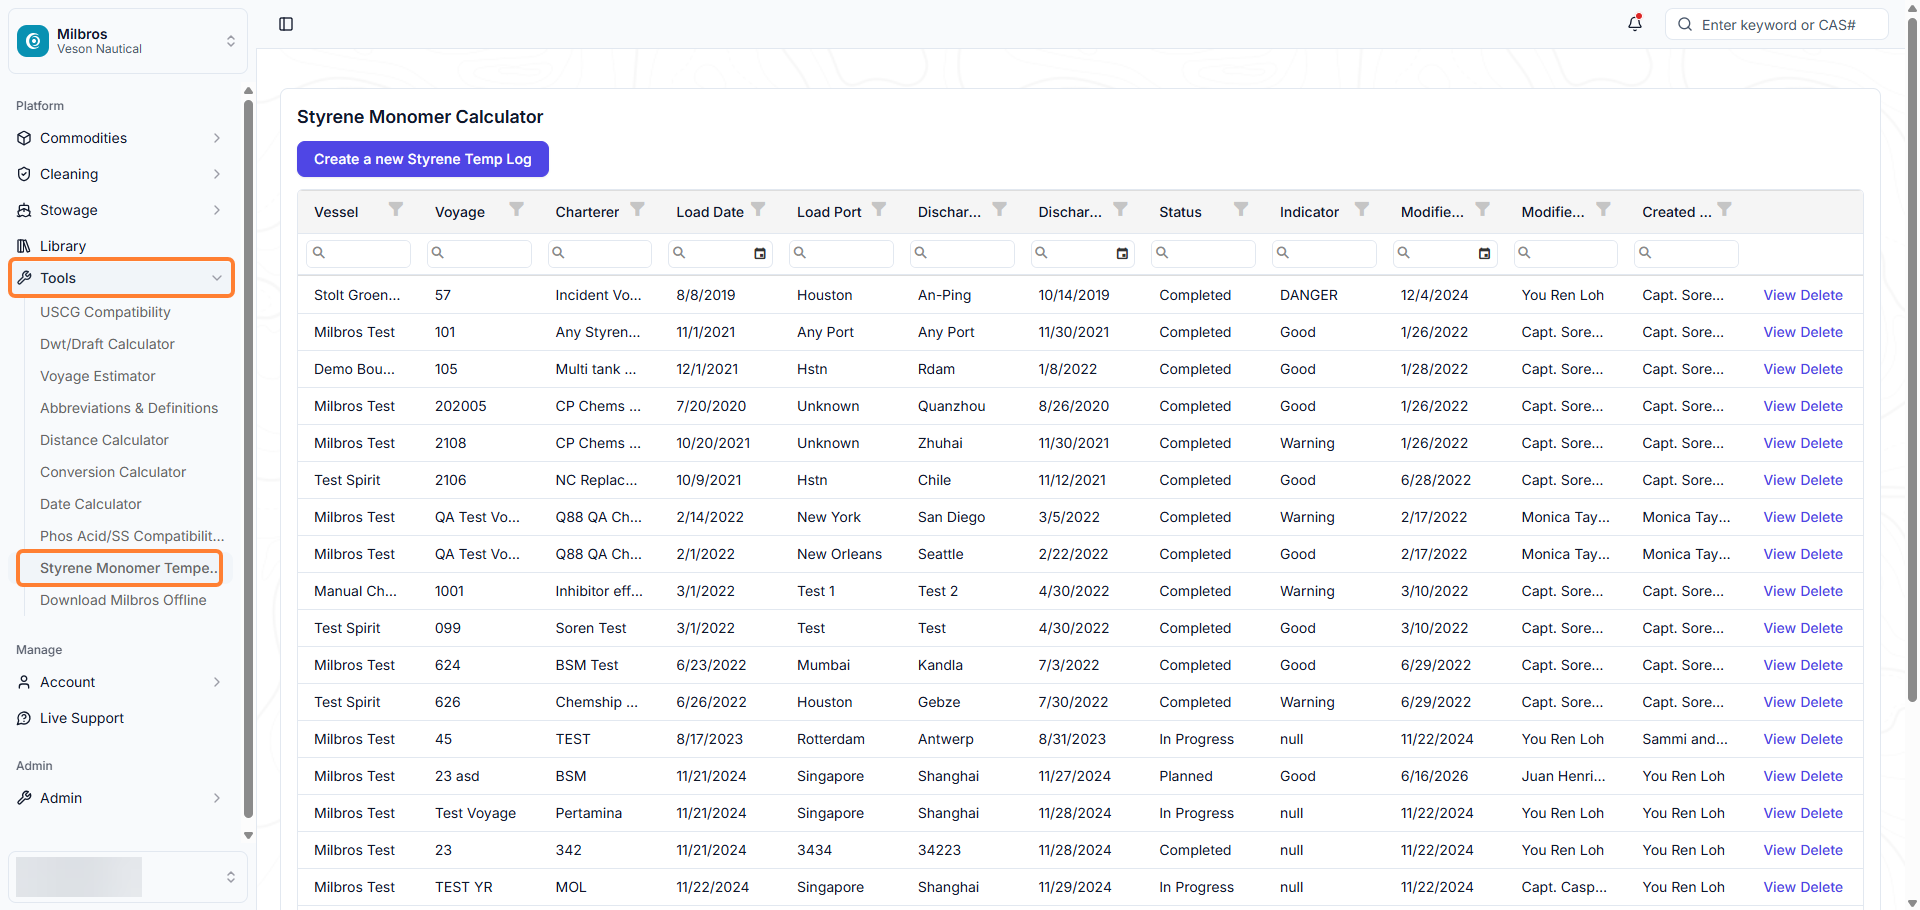
Select Styrene Monomer Temperature Log from the Tools dropdown menu or select from the main screen:
-
You will be taken to this screen. Click on Create a new Styrene Temp Log button:

-
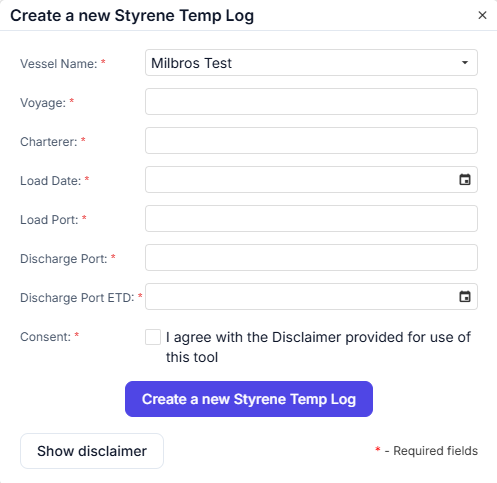
You will get this input screen (data inserted below for demo purposes):
-
The required fields are described below:
|
Vessel Name: |
Select Vessel Name from dropdown list. |
|---|---|
|
Voyage: |
Enter Voyage (numbers and/or text). |
|
Charterer: |
Enter Charterer Name. |
|
Load Date: |
Select Load Date from Calendar Icon. |
|
Load Port: |
Enter Load Port. |
|
Discharge Port: |
Enter Discharge Port. |
|
Discharge Port ETD: |
Select Estimated Date of Departure from Discharge Port. Note: Important for Calculations of the Tool |
|
Consent: |
Check off Agree with Disclaimer consent box. |
-
Click Create a new Styrene Temp Log to create:

-
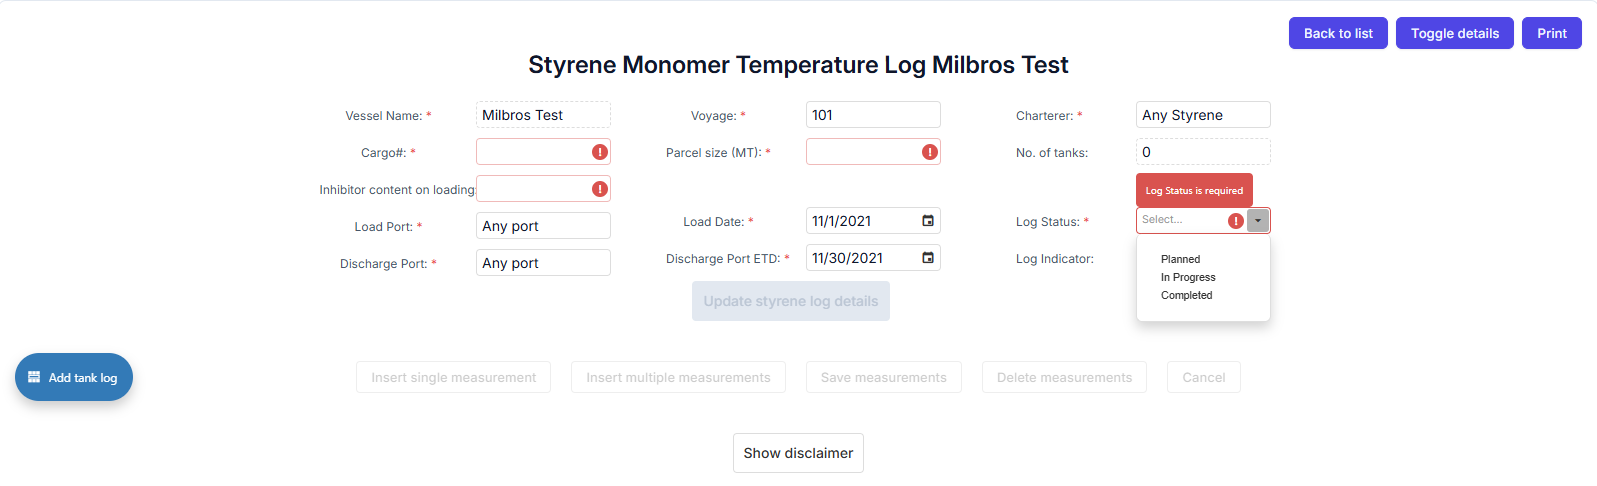
This takes you to this screen for following required fields marked with a red asterisk ( * ):
-
Cargo Number (whole number)
-
Parcel Size in Metric Tons
-
Inhibitor content on loading from Inhibitor Certificate in PPM of TBC
-
Select Log Status from dropdown (Planned, In Progress, Completed)
-
-
Then click on Add tank log:
-
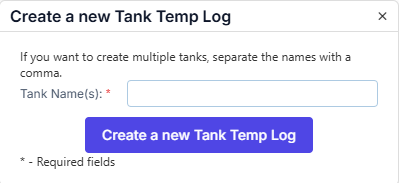
This pop up box appears:
-
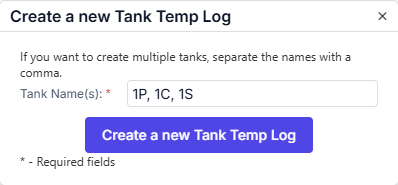
Add tanks used for this parcel. For multiple tanks separate tank ID’s by a comma (ie: 1P,1C,1S) as shown in the below example, and click on Create a new Tank Temp Log.
-
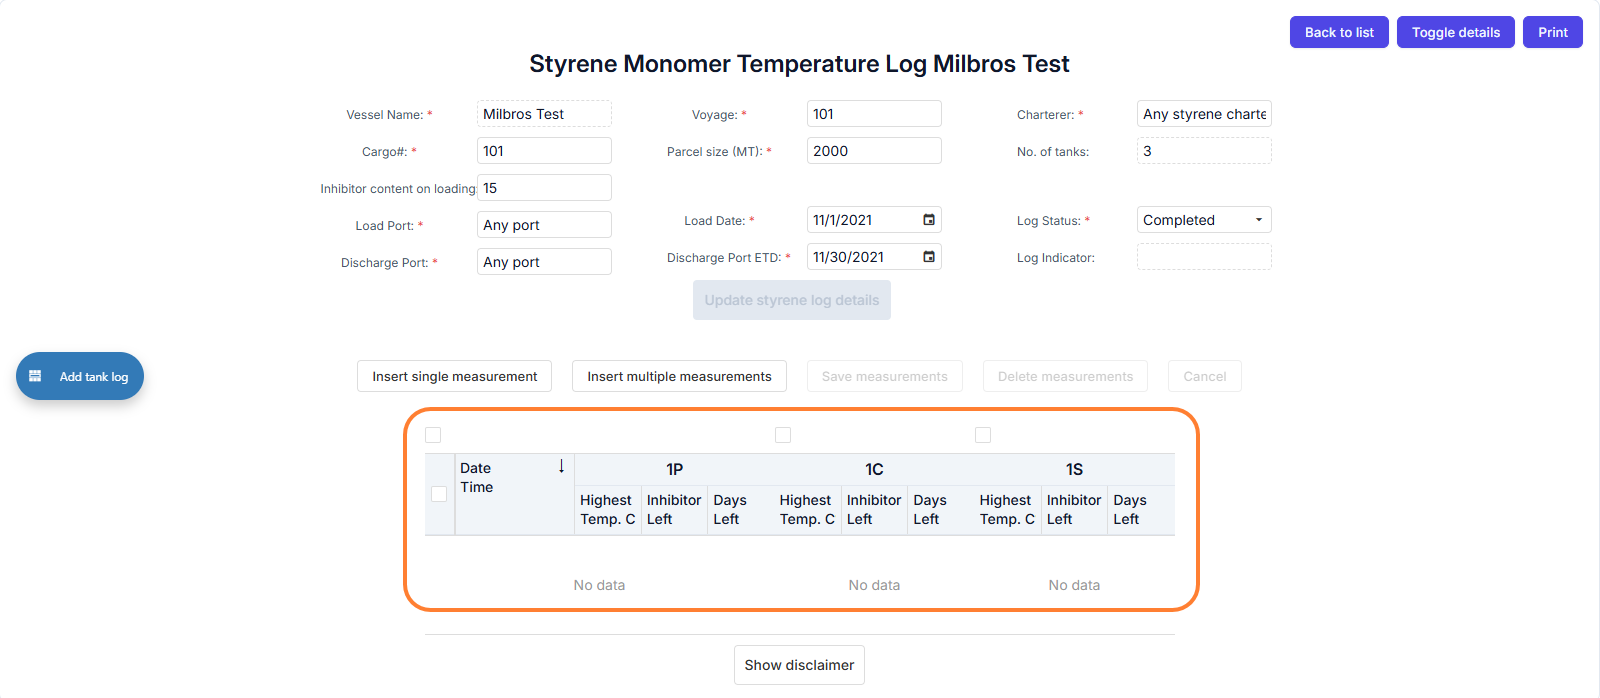
This will create the tank data grid as per below:
-
To add temperature readings for one date and time click on :

-
To add temperature readings for multiple dates and times click on:

-
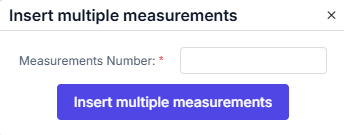
Then add the number of measurements to be entered in this pop-up:
-
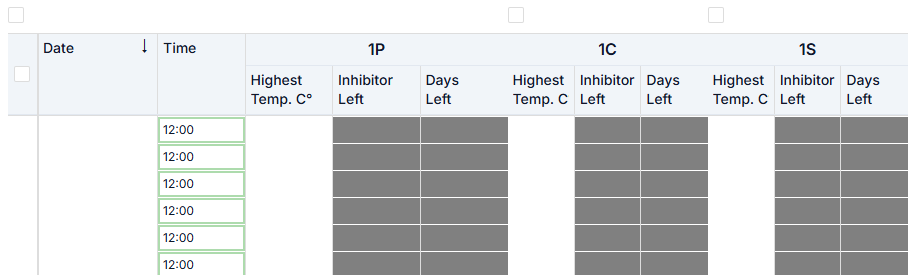
You will then get the below entry Grid:
-
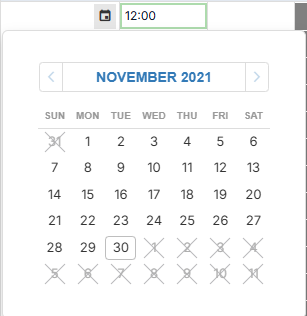
Click on the Calendar Icon to select the date:
-
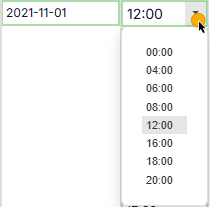
Then Select the closest time of the measurement from the time Dropdown (default is 1200).
-
Then enter the Highest temp reading for each tank from the top, middle or bottom reading in degrees C.

-
Once the grid entries are complete, click on:

The Tool then calculates the Inhibitor remaining in each tank along with how many days left of inhibitor effectiveness.
If the Days Left field turns yellow with a number or turns red with the word Danger then hover your mouse of that field for a warning message as per below:

If you happen to make entry mistakes you can delete the entire entry row by activating the box as indicated below and then click on Delete measurements.
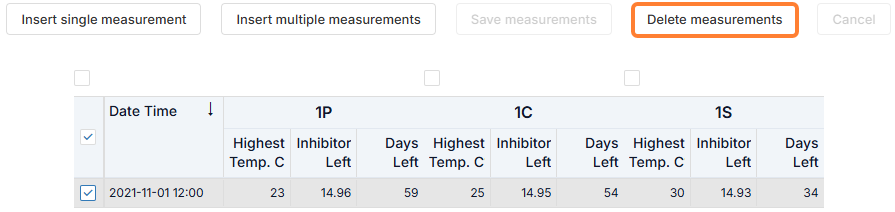
Then re-enter correct data as needed.
Additional buttons:

-
The Toggle details button will hide and unhide the voyage information details.
-
The Print button will print the log from your browser. The print option should allow you to save the image to PDF or print as needed.
-
The Back to list button will take you back to the list of saved temp logs under the account. Click on View to return to the log and make new entries each day until the cargo is discharged.
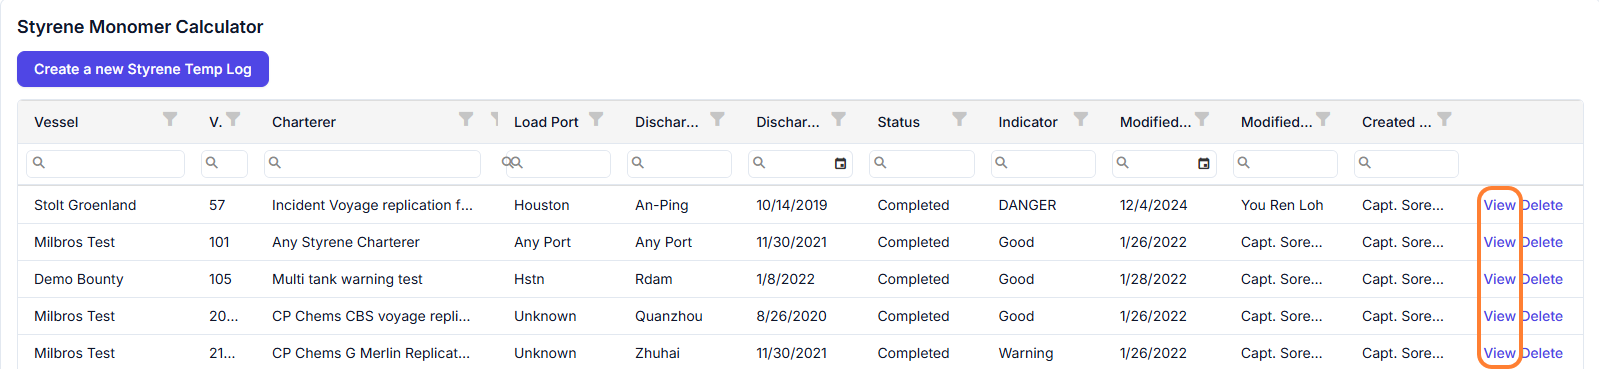
After the voyage is completed change the Log Status to Completed.
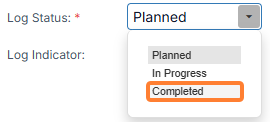
Then click on Update styrene log details.

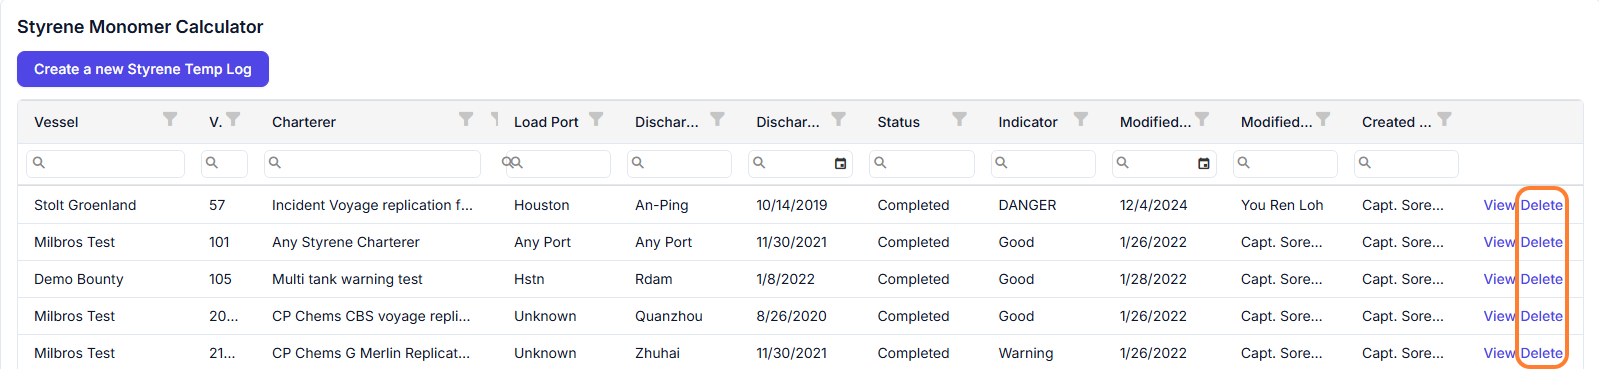
You may also delete an entire calculation by clicking on the Delete link.