This article describes our proprietary Market Trends section of the Insights - what they mean and how to use them

Overview
Shipfix is the only platform that is able to provide a factual, data-driven overview of the fundementals (Supply/Demand) circulated in the global freight market (by shipowner, operators, brokers, charters, freight forwarders, etc). Shipfix achieves this by anonymising and aggregating billions of data points captured from across the Shipfix community of contributing member companies.
Our global coverage includes over 460 type of commodities/products across major maritime trade routes and all commercial vessels over 100GT 60k on the water.
-
Demand 📦: Cargoes - as circulated in the freight market by charterers (mining/trading groups, industrials, manufacturers, operators etc), or the brokers that represent them.
-
Supply 🚢: Vessels - the commercial opening positions of vessels as circulated in the freight market by shipowners and/or vessel operators, or the brokers that represent them.
NOTE: At any one time, Shipfix 'sees' the same Cargo or Vessel Position multiple times from multiple market participants. We therefore 'de-duplicate' the data so that each Cargo or Vessel Position is only counted ONCE in the aggregated & anonymised data.
Shipfix's proprietary Market Trends show the volume of cargoes and vessel positions that are advertised in the market. It does not necessarily capture all of the sensitive "off-market" business that is conducted over the phone, or indeed cargoes that are transported by companies that own/operate their own fleet (ie: cargoes put onto vessels 'inhouse').
"Demand - Orders": cargo orders seeking transportation
On all of the charts in this section, you can choose to:
-
define the Load and/or Discharge areas, ranges, or countries
-
define the Order Sizes (as advertised)
-
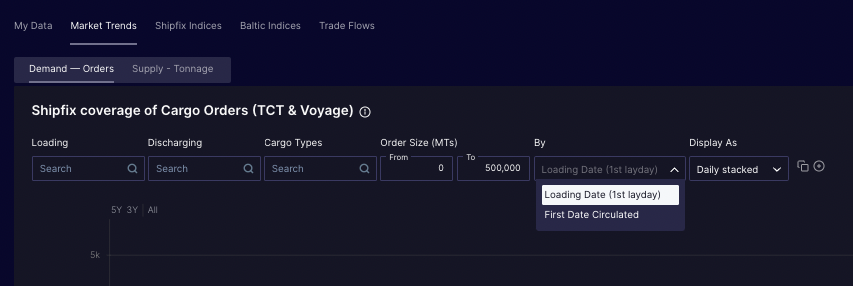
define whether you wish to view the data based on the First Date Circulated or the First Layday (the first possible loading date)
-
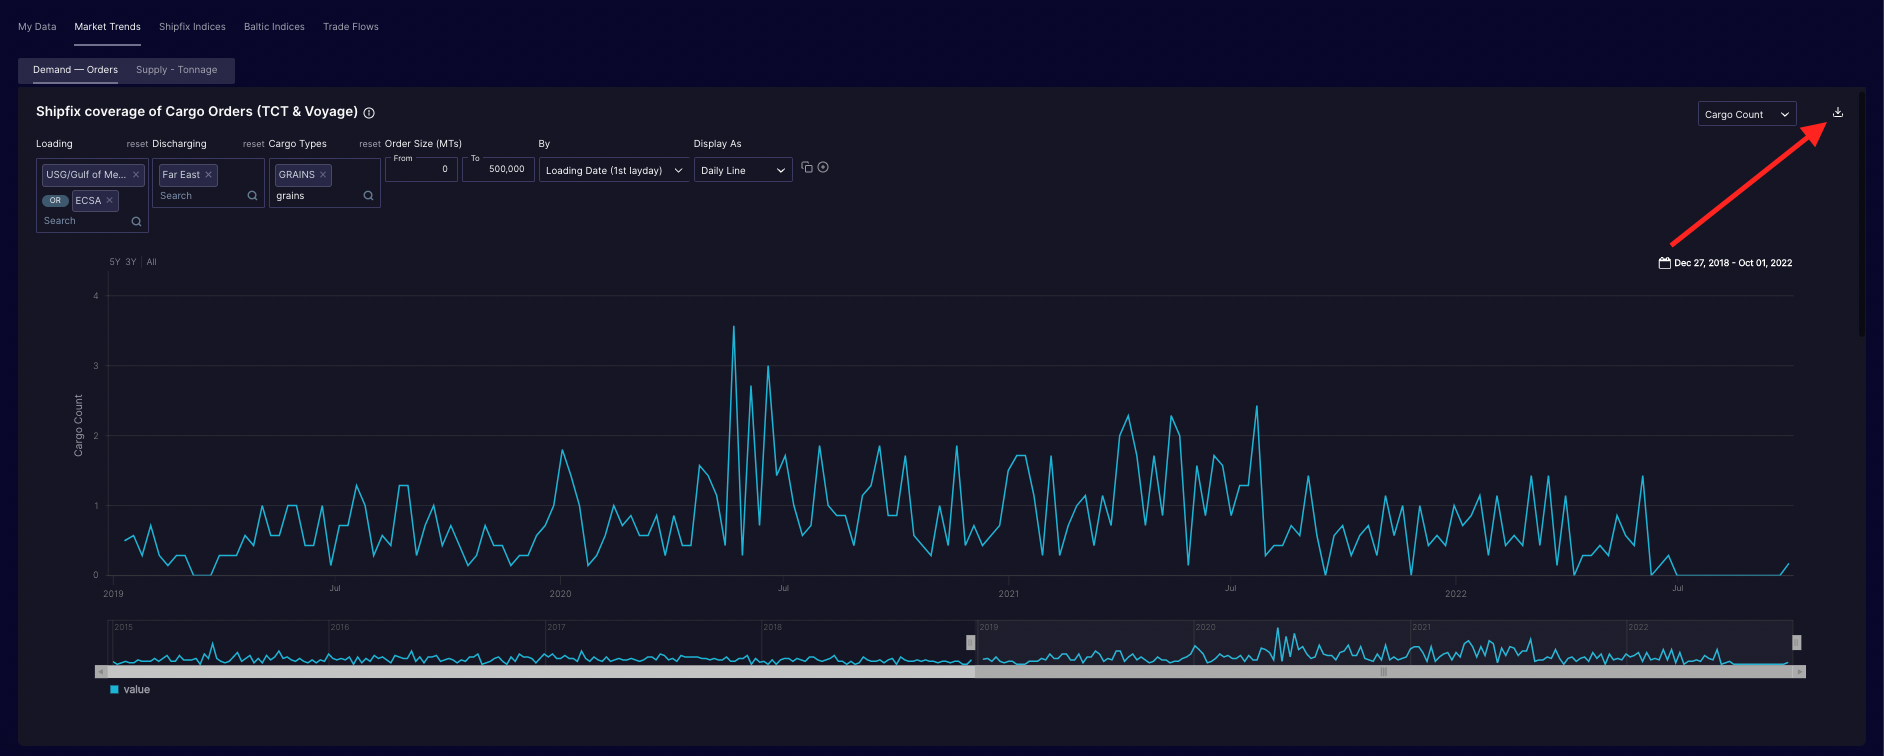
define whether you wish to view the Total MT Volume of Cargoes (Cargo Size in metric tonnes) or the Total Number of Orders (Cargo Count in number).
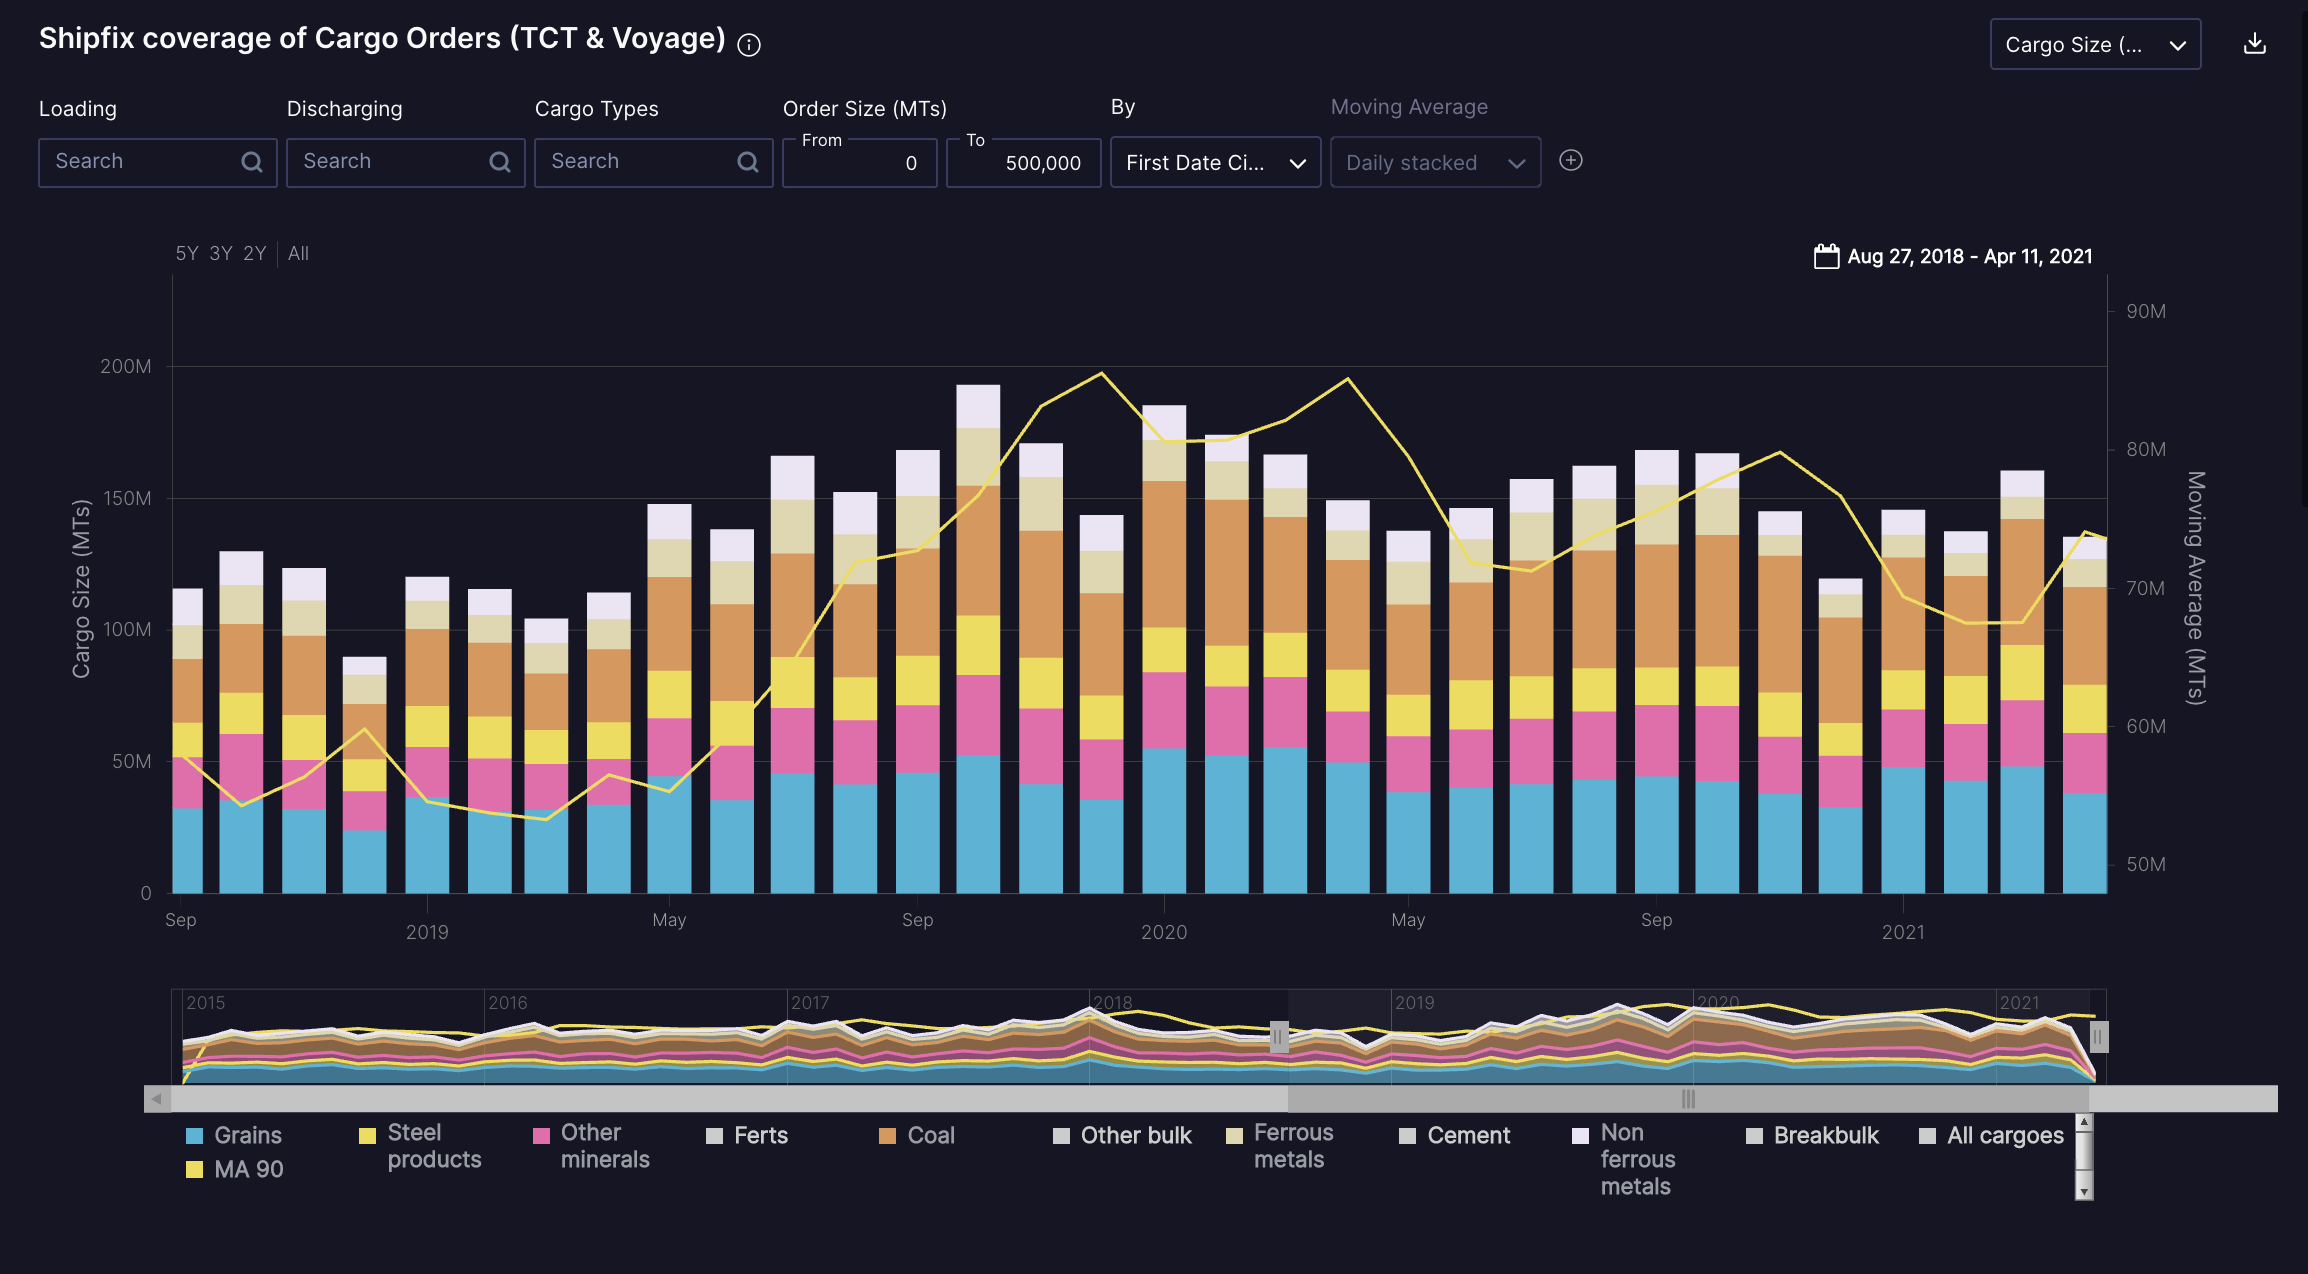
The first chart (below) displays a time series of Shipfix's Historical coverage of Cargo Orders. This includes both the demand for Voyage Charters and Time Charter Trips.
The default setting for this chart (when no filters are applied) is to display all high level cargo categories covered by Shipfix. They are stacked to represent the total volume of Cargoes advertised in the market and captured by Shipfix.
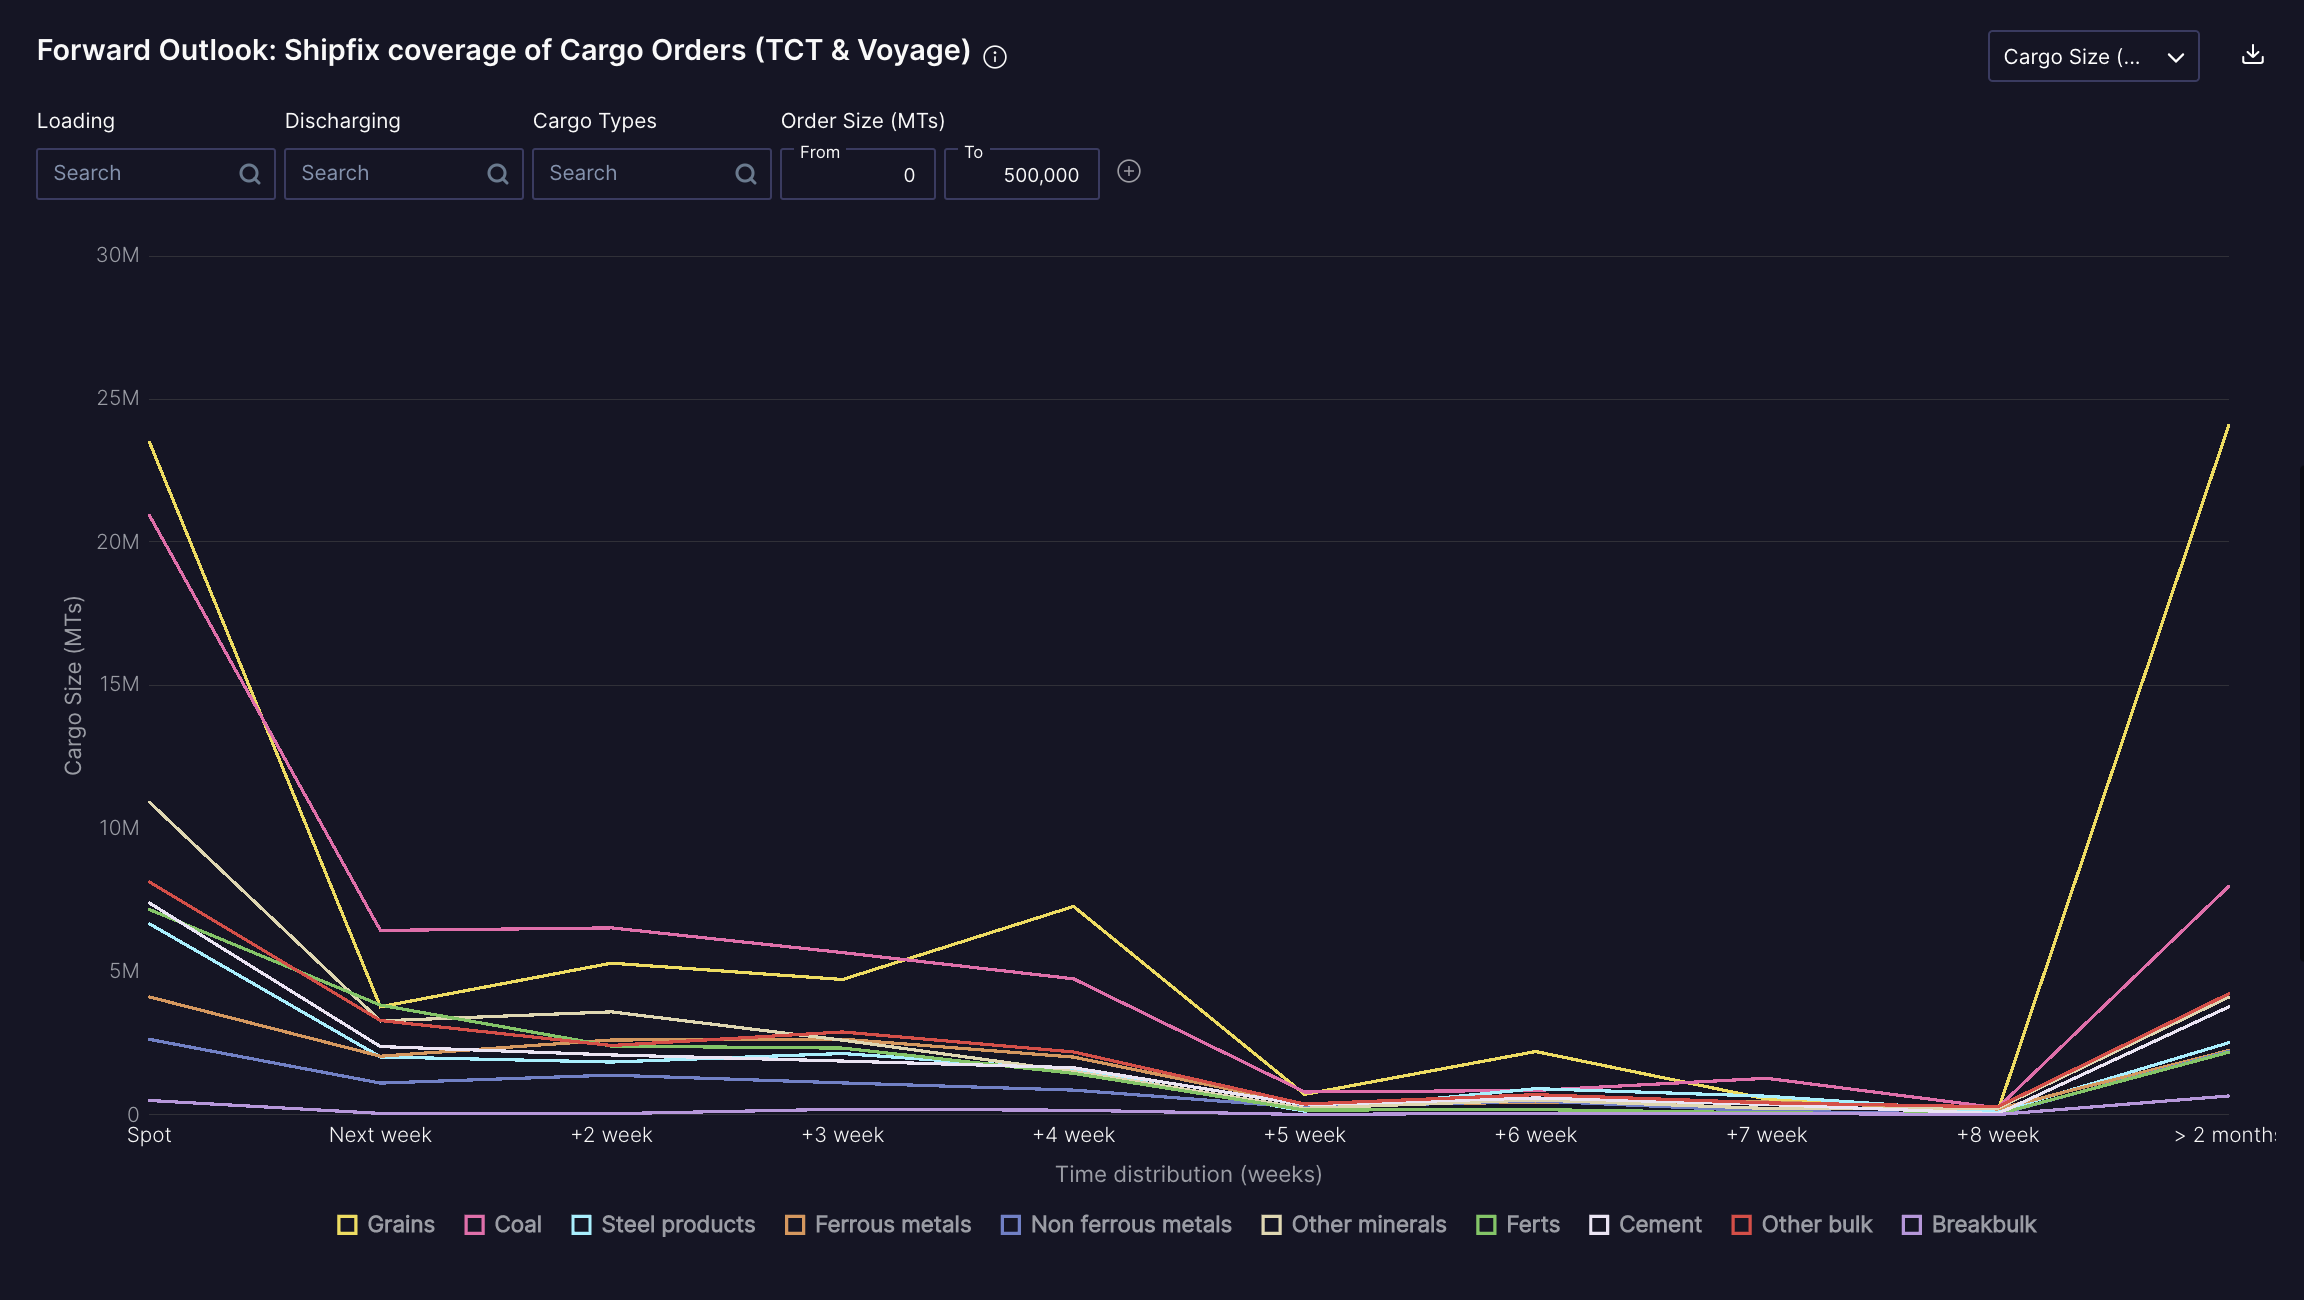
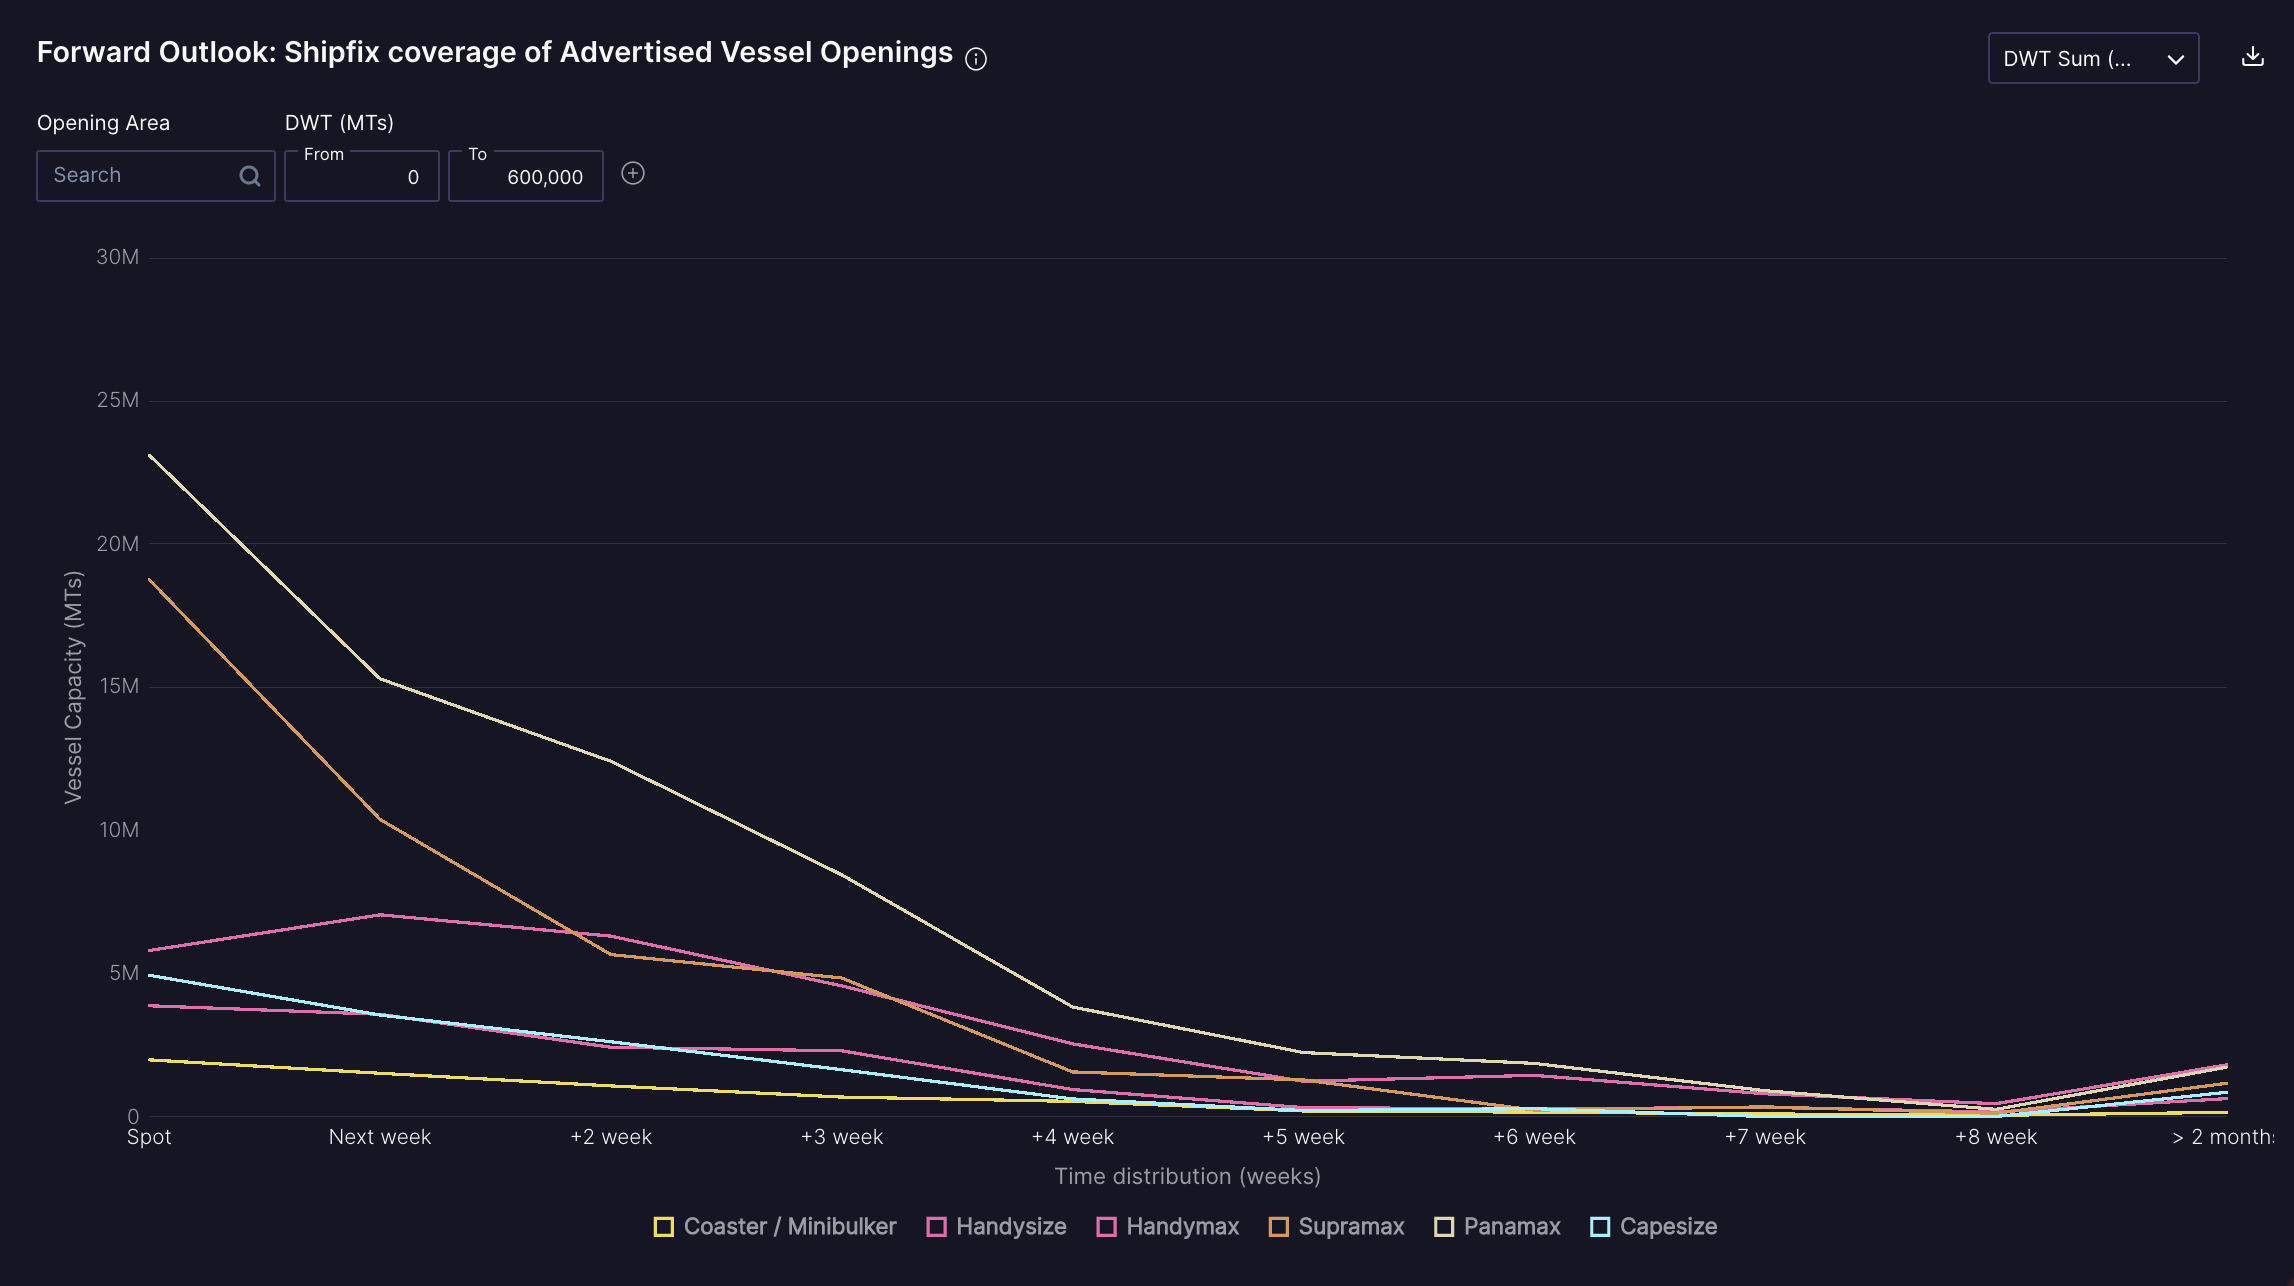
The second chart (below) presents a forward outlook of cargoes advertised on a spot onwards basis in weekly buckets and then a final bucket that represent the "forward market" beyond 8 weeks.
The third chart (below) measures the market lead time, which is calculated as the average number of days between the time at which a cargo order is circulated in the market and the first advertised loading date for that cargo in the spot market. Whereas the first two charts cover more fundamental market data, this one is an unprecedented indicator or market sentiment.
Please note that for the purpose of calculating the Market Lead Time indicator, Shipfix excludes business advertised beyond 8 weeks (considered to be in the "forward" market)
.png)
"Supply - Tonnage": Advertised Vessel Openings
On all of the charts in this section, you can choose to:
-
define the Opening Area (areas, range, or countries)
-
define the Vessel Size range (DWT)
-
define whether you wish to view the data based on the First Date Circulated or the First Opening Date
-
define whether you wish to view the Total DWT Volume of Vessel Openings (DWT Sum) or the Total Number of Vessel Openings (Vessel Count in number)
Tonnages are clustered by geographic and time proximity. If a vessel is advertised in Santos on a given day and in Rio a few days later, this vessel will be counted only once. And if the same vessel is open in China 2 months later, it will count as another tonnage.
You can then choose between two time axes:
-
First Date Circulated: each point in time shows each tonnage position on the first date that the tonnage position was circulated.
-
Opening Date: each point in time shows each tonnage position on the first advertised opening date. If a vessel is postponed, it will only appear once, on the first opening date of the latest update.
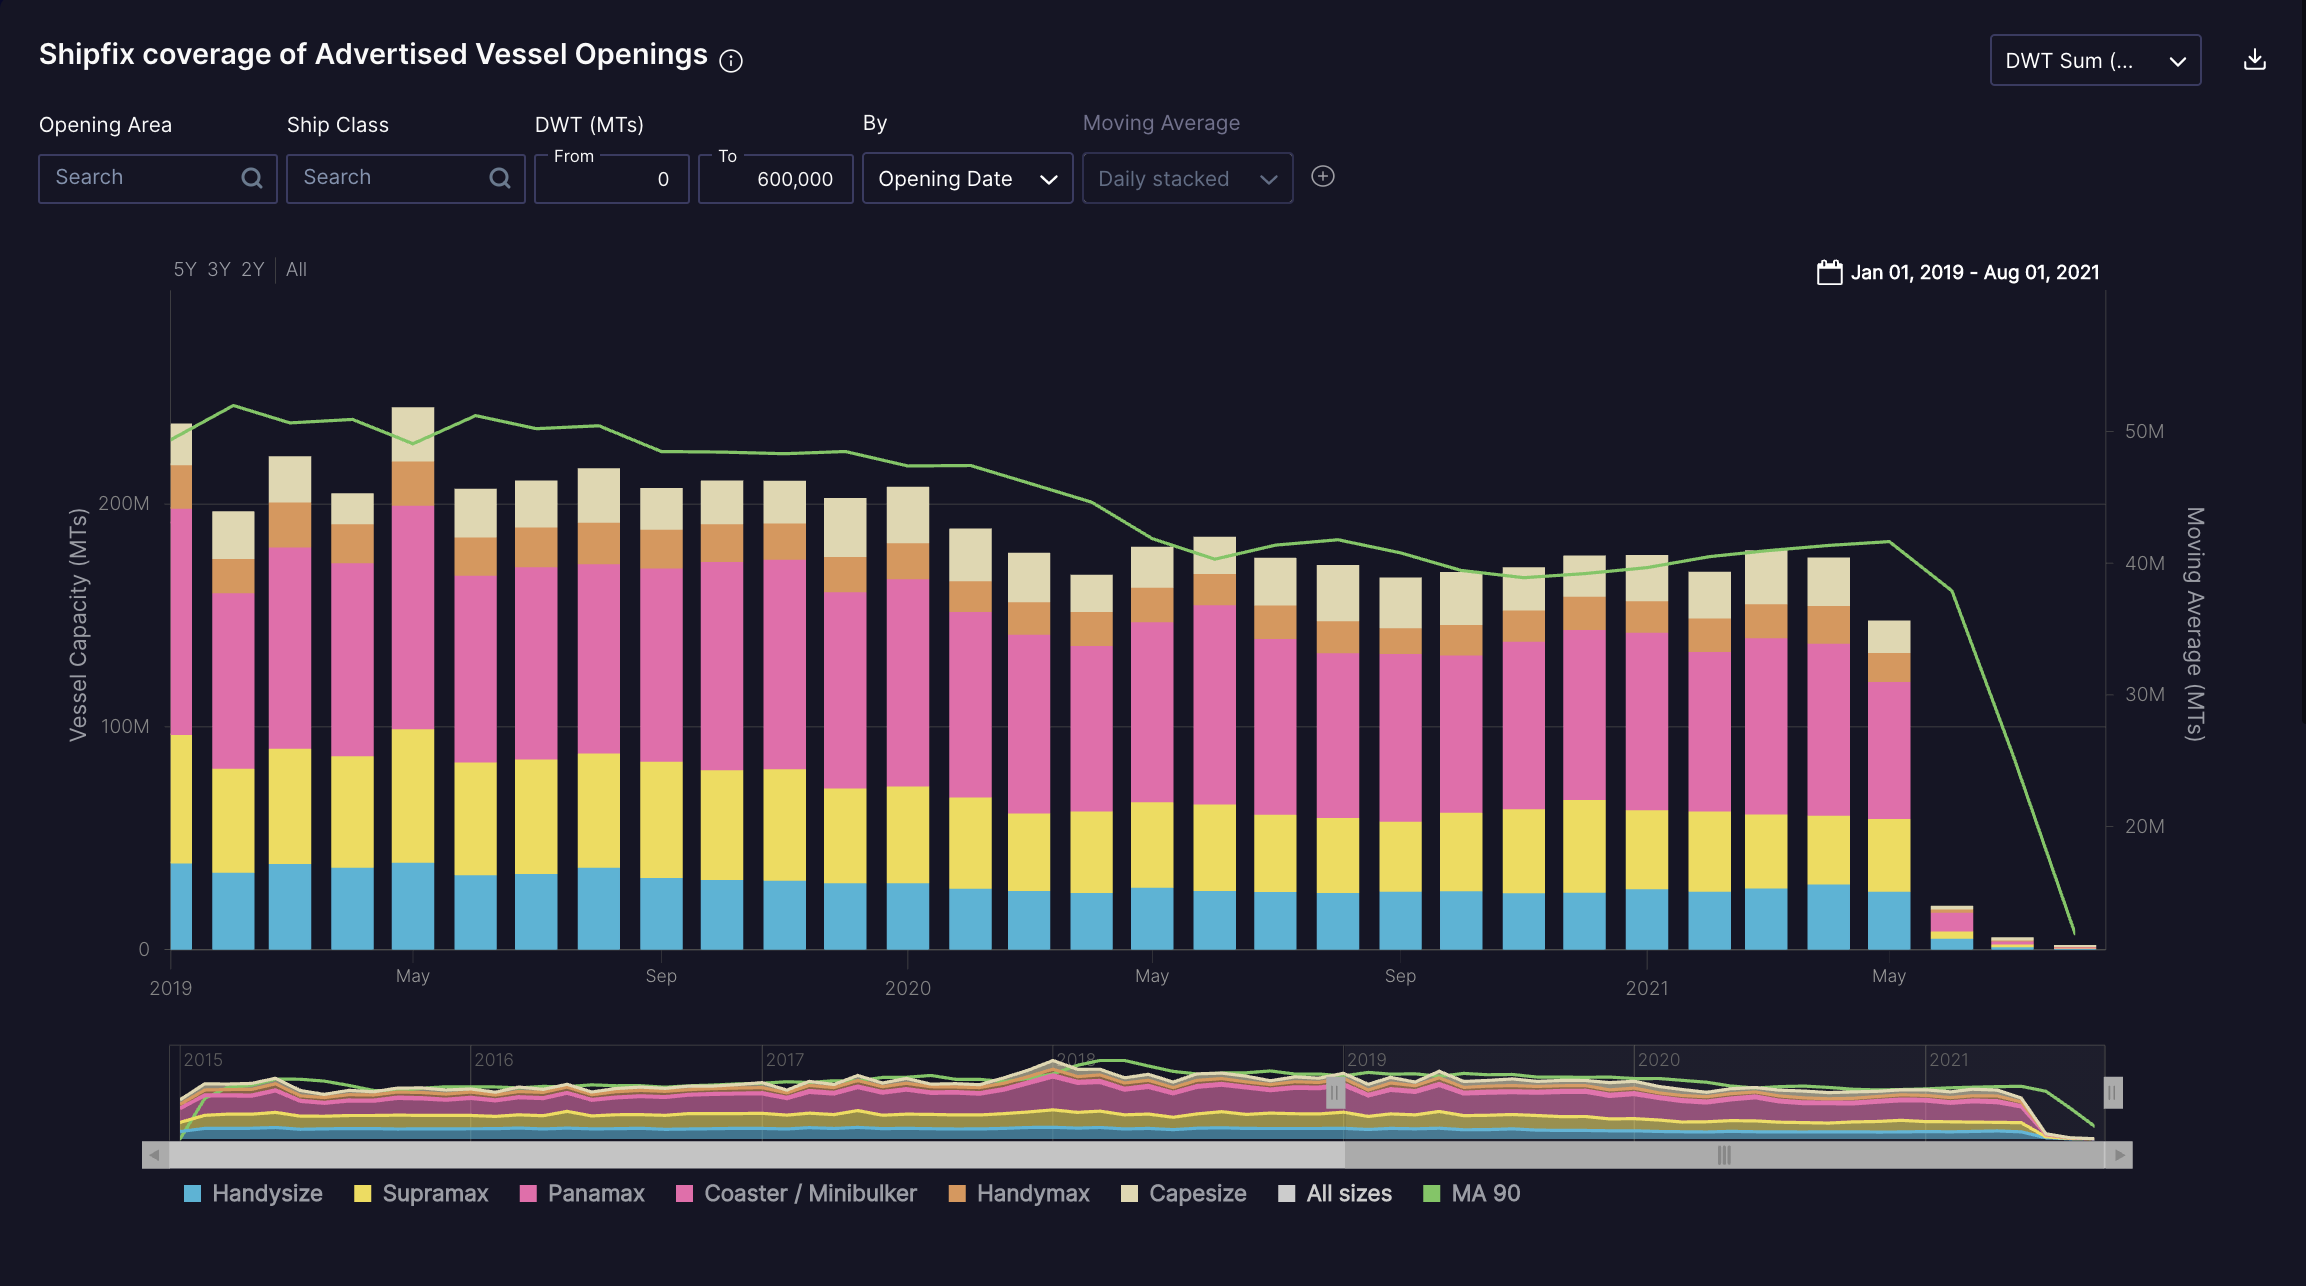
The first chart (below) displays a time series of Shipfix's Historical coverage of advertised vessel openings in the market.
The default view shows a stacked chart of the global commercial fleet by ship class (eg: Handysize, Cape, Panamax).
The second chart presents a forward outlook of advertised vessel openings on a spot onwards basis in weekly buckets and then a final bucket that represents the "forward market" beyond 8 weeks.
Working with charts: how to apply filters and compare multiple data series
In this section, we aim to describe the powerful filters that allow you to refine your search. These filters apply to both time series charts and forward outlook curves
Area filters:
Shipfix area filters are available both on the supply and demand side
-
Cargo Orders: Loading and/or Discharge can be selected
-
Advertised Vessel Openings: Open Area
Our area filters feature both "macro" regions and specific countries. Using Macro regions will include all of the countries that fall under that region (e.g: East Coast South America (ECSA) includes ports and vessel delivery areas along the full coastline including Brazil, Uruguay and Argentina)
These filters can be compounded and used in combination. You can also exclude an area by first adding it to the filters and then clicking on it to exclude it as illustrated below:
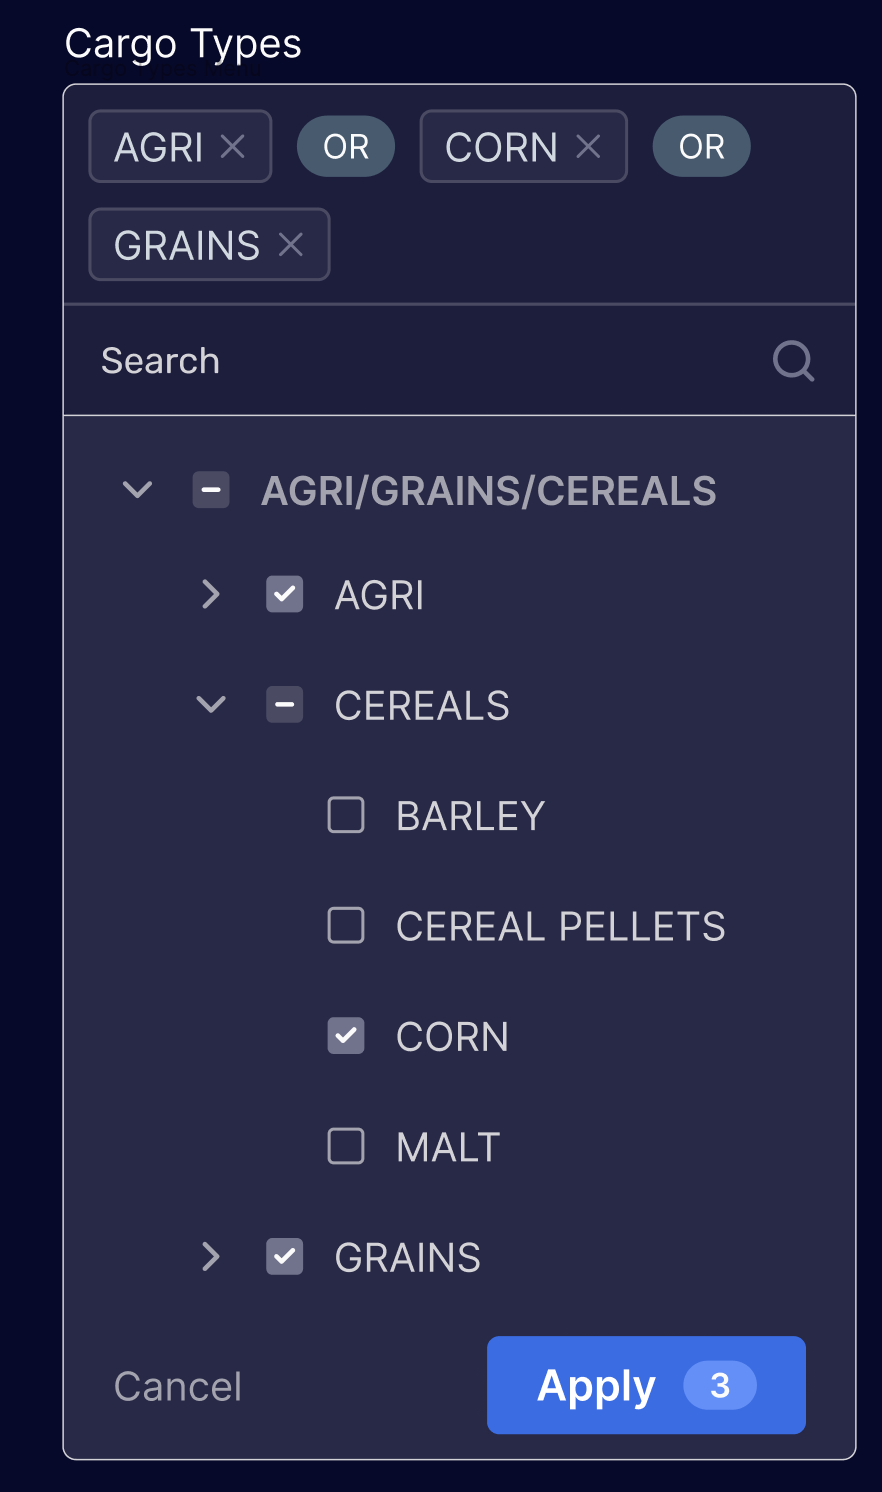
Filtering by cargo type:
Cargo Orders can be filtered by cargo type
Filtering by size range:
Shipfix allow you define a size range on both the supply and demand side of the market.
-
Cargo orders can be filtered by cargo "stem size". For example you may want to display only grain orders between 50,000 and 80,000 metric tons between ECSA and the Far East
-
Vessel openings can be filtered by specifying a specific vessel size range in deadweight tons. For example you may only wish to see "short-sea" vessels advertised in the spot market between 5,000 and 20,000 tons
Changing the date reference in time series charts:
Each time series chart allows you to choose the reference date used to display the data visually in a chart as follows:
-
Cargo Orders: either by first loading day (1st Layday) or by 1st date circulated in the market
-
Vessel Opening: either by first opening date or by 1st date circulated in the market
Changing the type of chart display in time series charts:
You can change the visual display of times series for both cargo orders and advertised vessel openings in the last filter box as illustrated below.
Typically daily lines or daily stacks are best used to observe overnight trends or variations occurring over a few weeks at best. Long-term historical trends such as seasonality or cyclicality are best visualised by using a moving average. However, the statistical smoothing effect of displaying a moving average instead of the daily data will mute any meaningful market signal that occurs in a short period of time (e.g.: seeing an overnight peak in cargo orders)
Adding 1 or more data series on the same chart:
You can add another data series to any chart by clicking on the ➕sign on the right of the filter row above the chart. Multiple data series can be compared on the same chart simultaneously
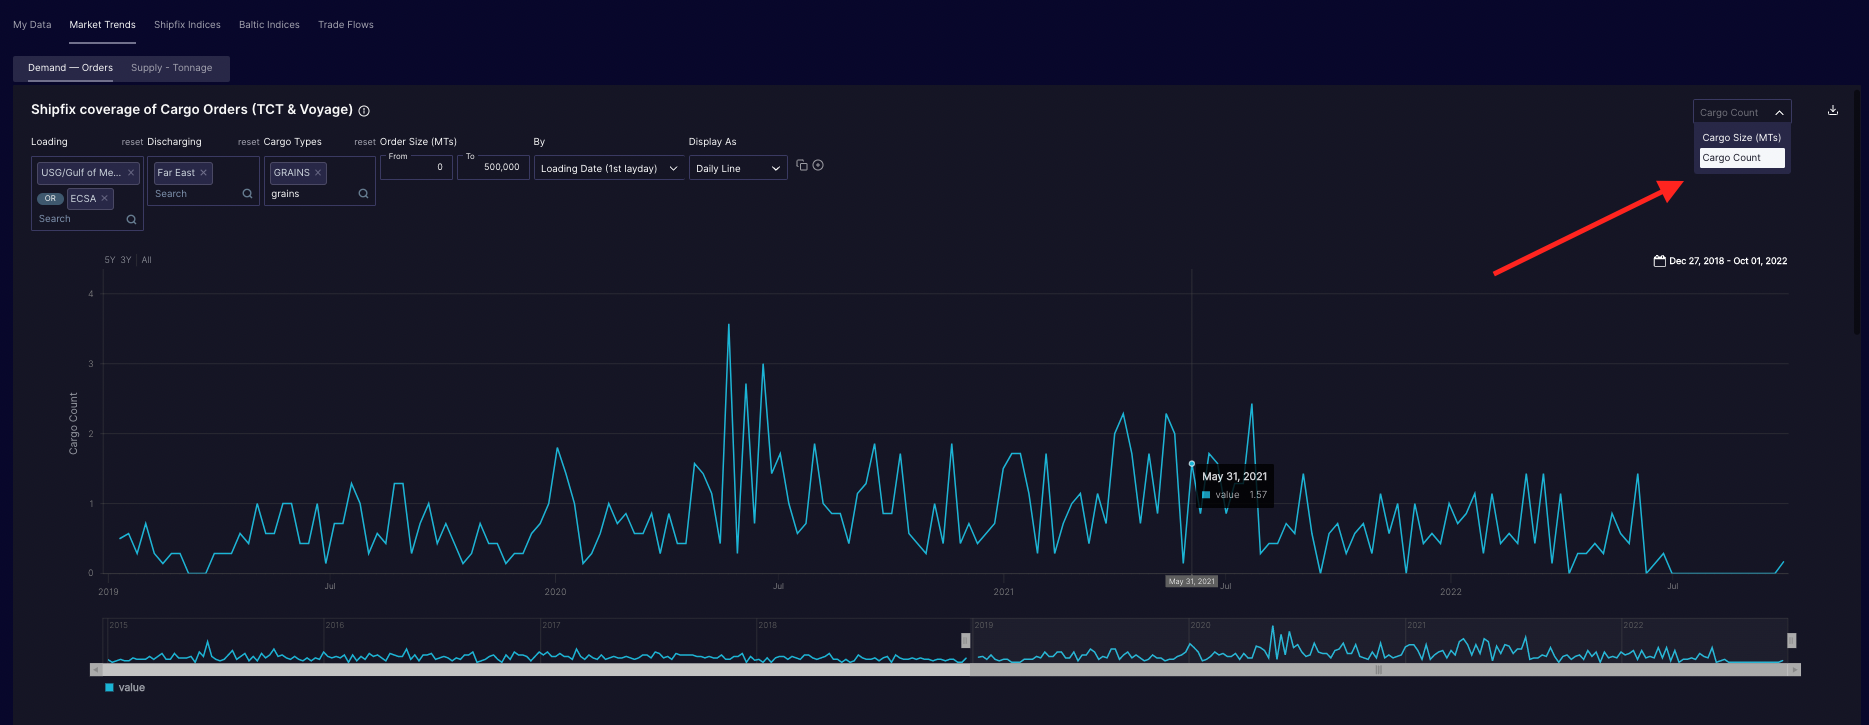
Switching the chart display from volume in metric tons to number of market occurrences:
You can change the type of count displayed on the top of each chart on the top right of each chart as follows:
-
Cargo Orders: switch between aggregate Cargo Size (MTs) and the Cargo Count
-
Vessel Openings: switch between DWT Sum (MTs) and Vessel Count
Download the underlying data behind any chart:
You can download the data behind any chart with a single click on the dedicated icon on the top right of the chart.