About the Module
The Freight Analytics module is designed to provide chartering and trading teams with a comprehensive overview of orders, tonnage counts, and price dynamics in their key ‘load areas’, segmented by vessel size. Each page corresponds to a specific load area, such as the US Gulf Supramax.
The module's primary goal is to assist commercial shipping professionals in determining optimal vessel fixtures based on demand and supply curves. Leveraging Shipfix's proprietary data sourced from over 1000 users, including aggregated, deduplicated, and anonymized cargo order and tonnage circular data, this tool provides unique insights exclusive to Shipfix.
The Filters
The filters are split between the Main filters at the top of the page and there are sub-filters on individual graphs which further refine what data is displayed.
The Ship Class Filter
Shipfix has applied the following ship size definitions to segment the market.
Capesize: Over 100,000 DWT
Panamax: Between 68,000 and 99,999 DWT
Supramax: Between 40,000 and 67,999 DWT
Handysize: Between 20,000 and 39,999 DWT

The Area Filter
Shipfix has mapped out the relevant load areas for each segment. One Segment can be selected per page.

The Business Type Filter
The business type filter enables a user to decide whether they would like to see only voyage orders or just TCs or select both types of charter party types which is the default selection.

The Forward Period Filter
The forward period defines what forward period a user wants to focus on, with this filter covering both Cargo Orders & Tonnage.
Cargo Orders - If you select "Spot + 25 days" and today is June 1st, this will show cargo orders, that the first day of the laycan (first circulated laycan date) falls within the 1st June until the 26th June (both dates included).
Tonnage Circulars - If you select "Spot + 25 days" and today is 1st June, this will show tonnage circulars, that the first open date (first circulated open date) falls within the 1st of June until the 26th of June (both dates included).

The Circulated within Filter

The circulated within filter enables a user to decide whether just want to see circulars in recent emails such as ones sent within the last 5 days, this is working days so it excludes weekends.
An example of this is if Today is May 26th and if circulated within 5 days:
-> filter will include dates from May 21st (included) until May 26th
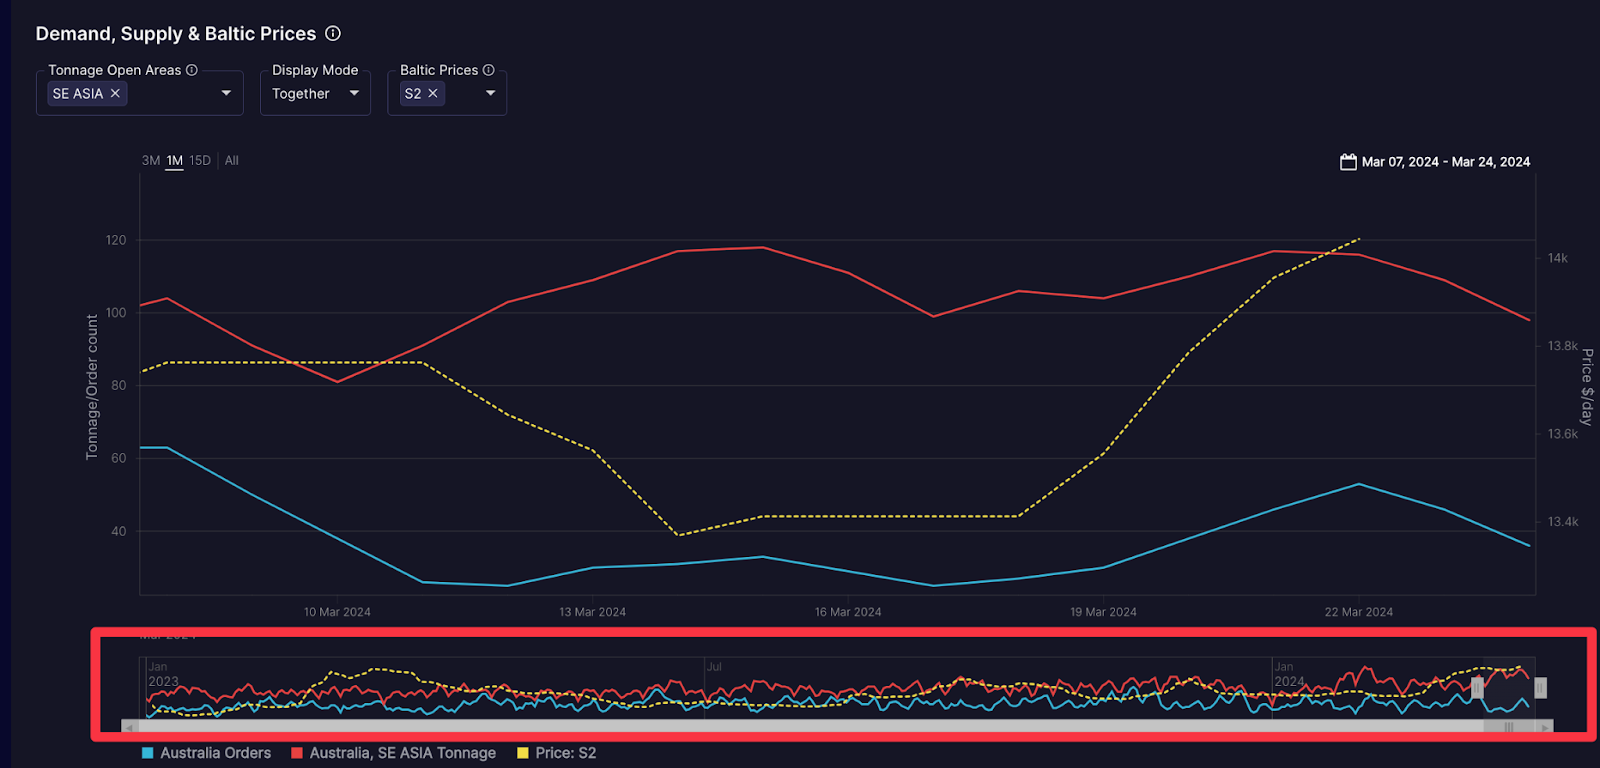
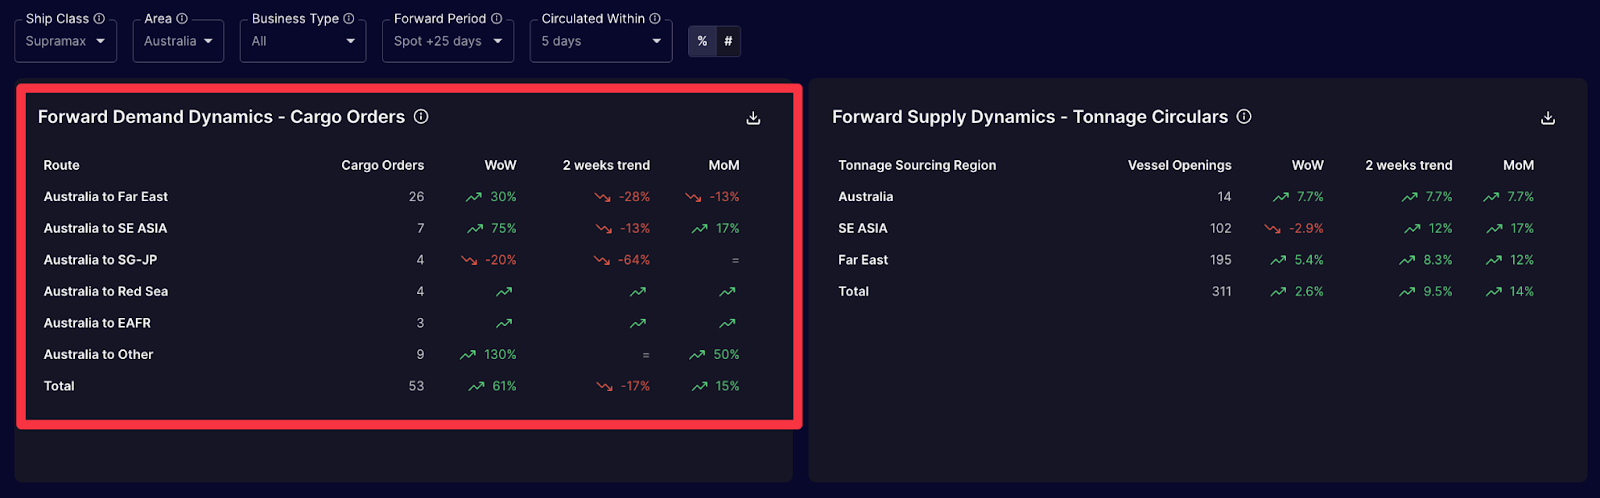
Demand - Cargo Orders
The table of the top left hand side of the screen shows the count of cargo orders, split by the top 5 routes, with routes outside the top 5 routes falling under the “other” category. The total is an overall total demand of all the routes out of the load area.
Supply - Tonnage Circulars
The table on the top right hand side of the screen shows the count of tonnage circulars relevant to the load area. The first area will be tonnage supply within the load area and underneath this will be all the relevant ballast areas where vessels are typically sourced from.
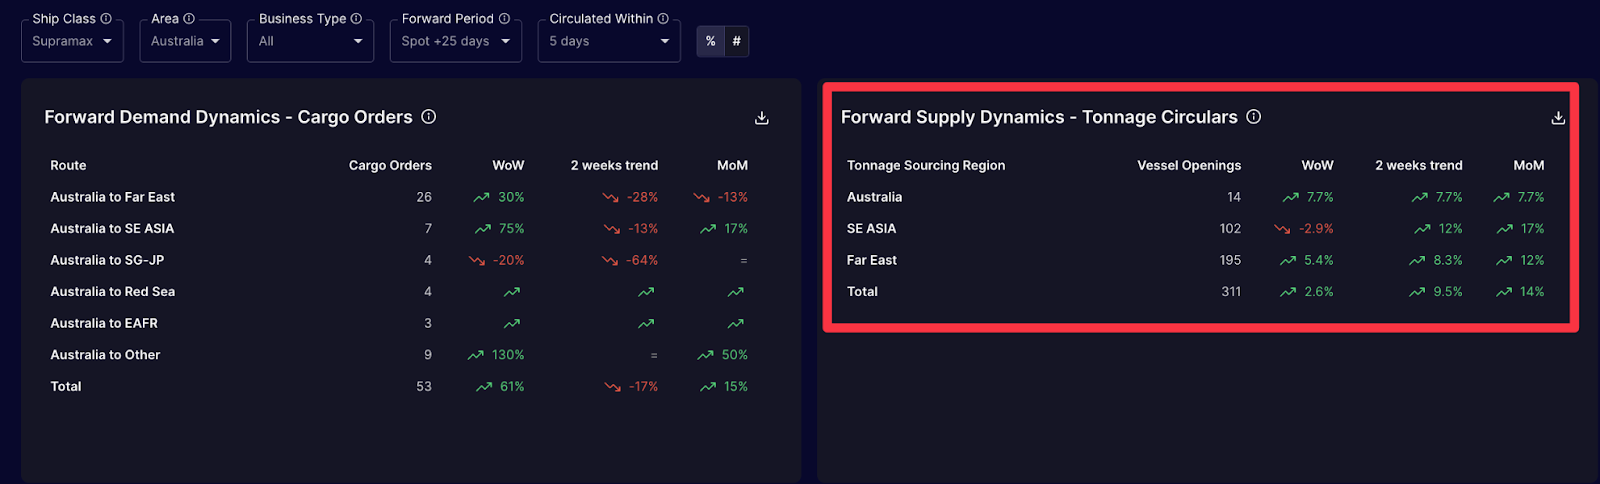
The Trend
WoW = Week on Week Trend = Current count of cargo orders versus the Count of orders in the same day of last week (current period - 7 days)
2 Week Trend = Current count of cargo orders versus the Count of orders in the same day of two week (current period - 14 days)
MoM = Current count of cargo orders versus the Count of orders in the same day 4 weeks ago (current period - 28 days)
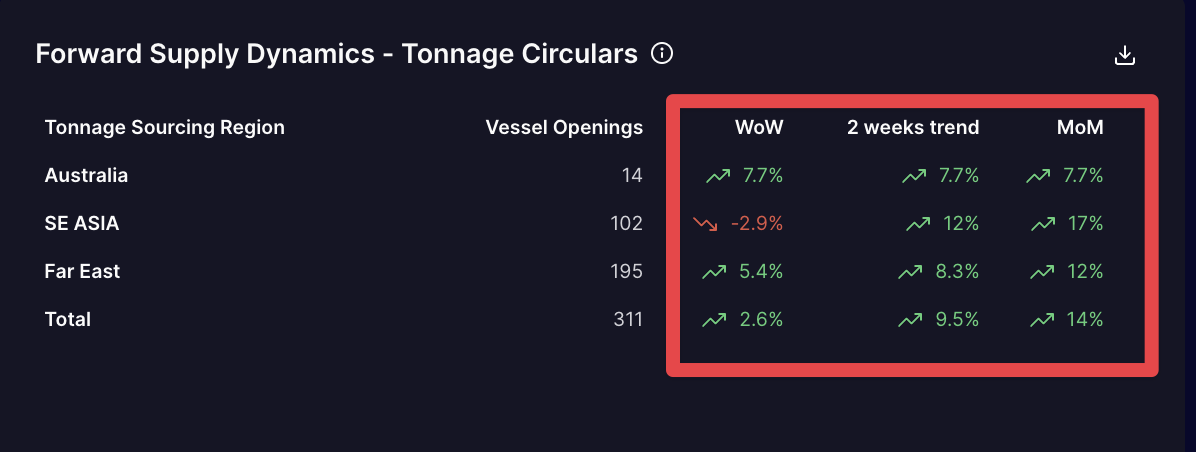
The % & # enables a user to switch between the trend being shown as a percentage or as a number.

The Demand, Supply & Baltic Prices Graph
This graph provides users with a daily count of the above tables based on the criteria that is selected in the main filters. This enables users to see quick market trends and correlations between demand, supply and price.
Tonnage Open Areas: these are ballast areas where typically ships are sourced from for the load area.
Multiple of these ballast areas can be selected together or separately to make up the supply of vessels.
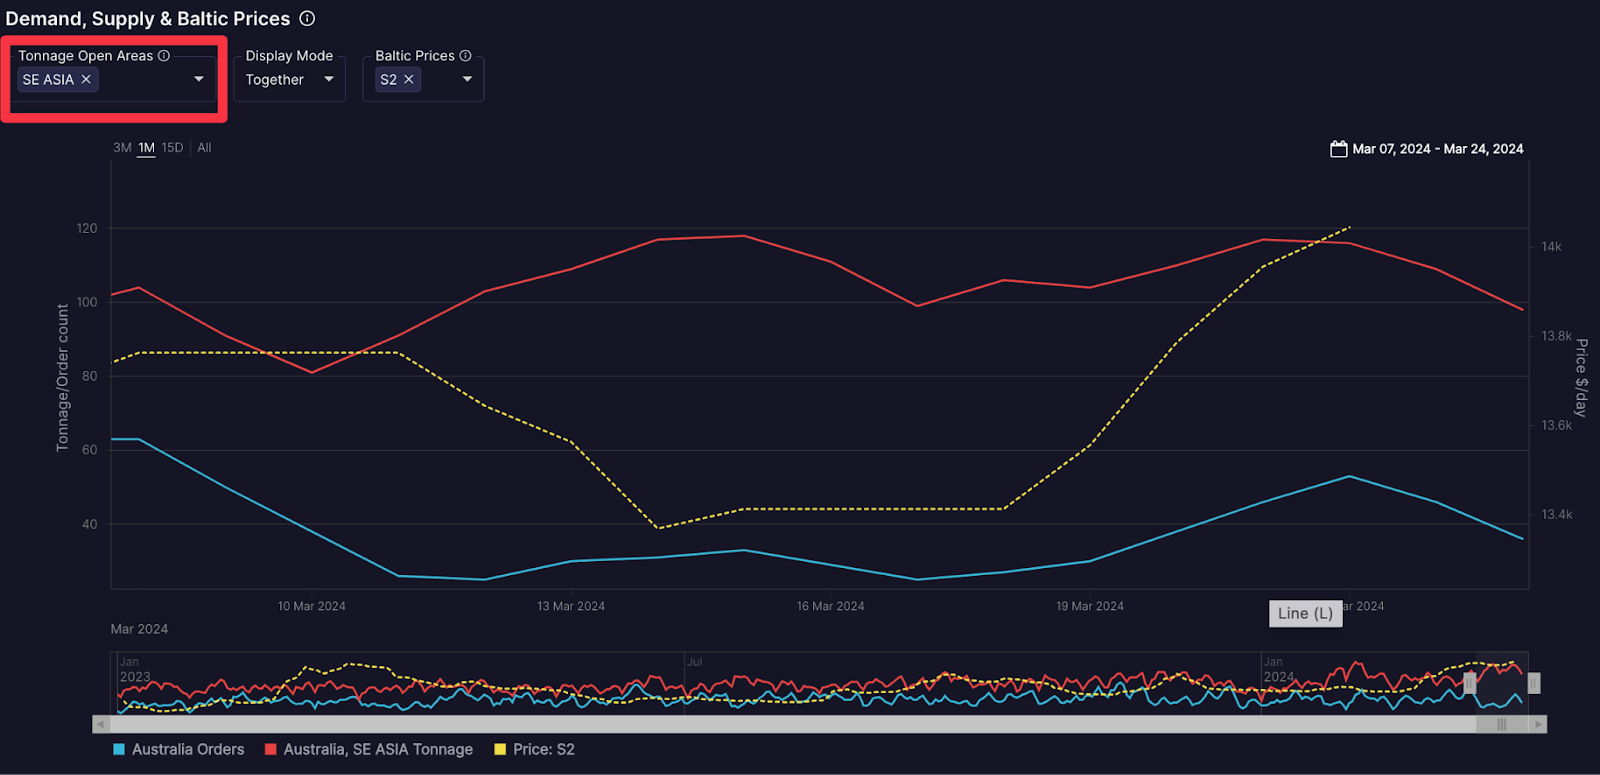
The display mode enables users to either see the Tonnage Open Areas added together as one series or split and shown as a separate series.
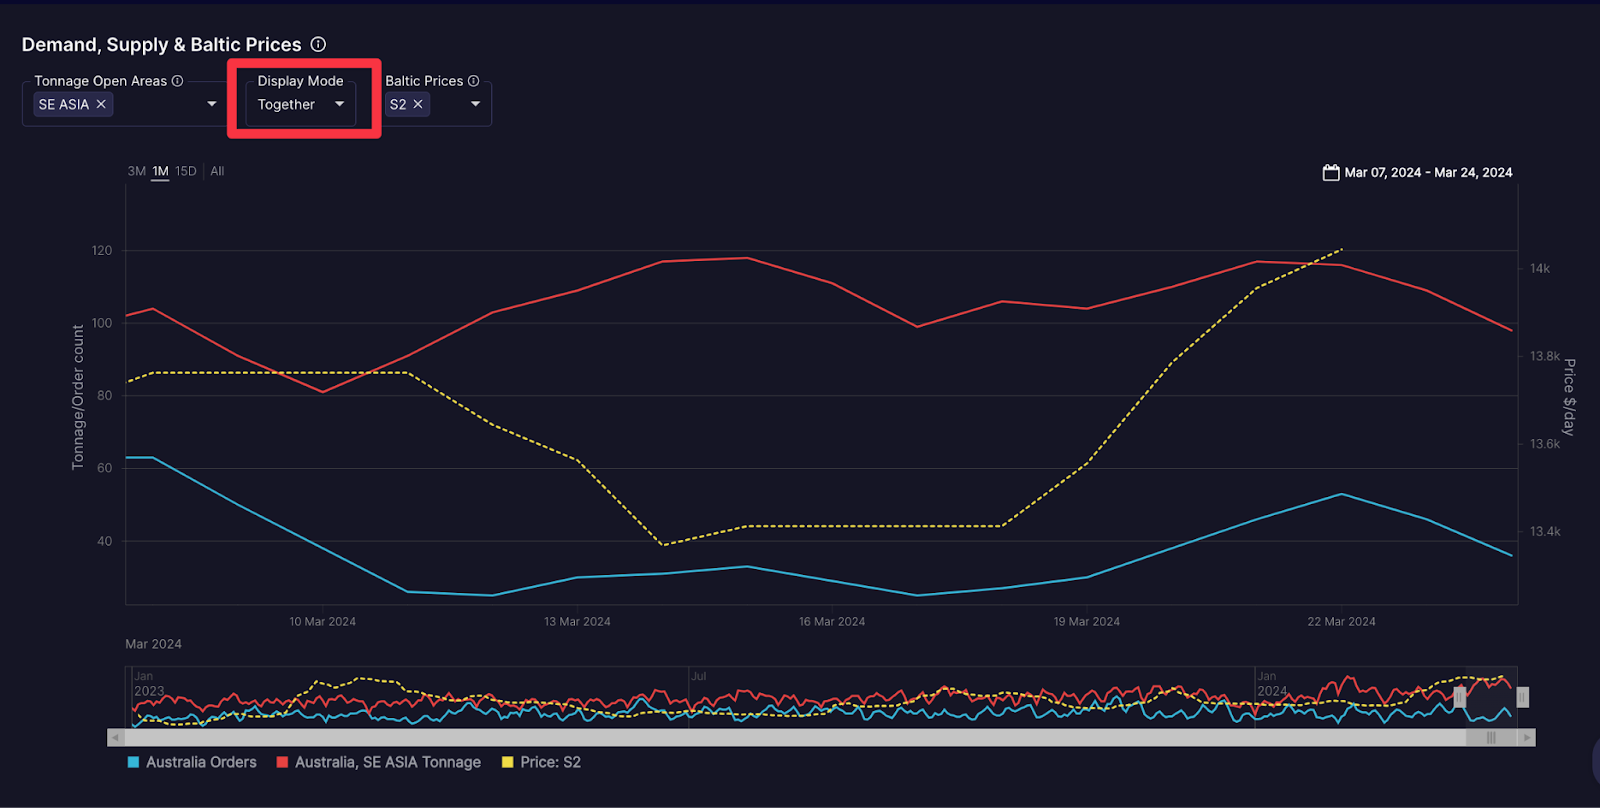
Baltic Prices - Shows derived data from the Baltic Exchange.
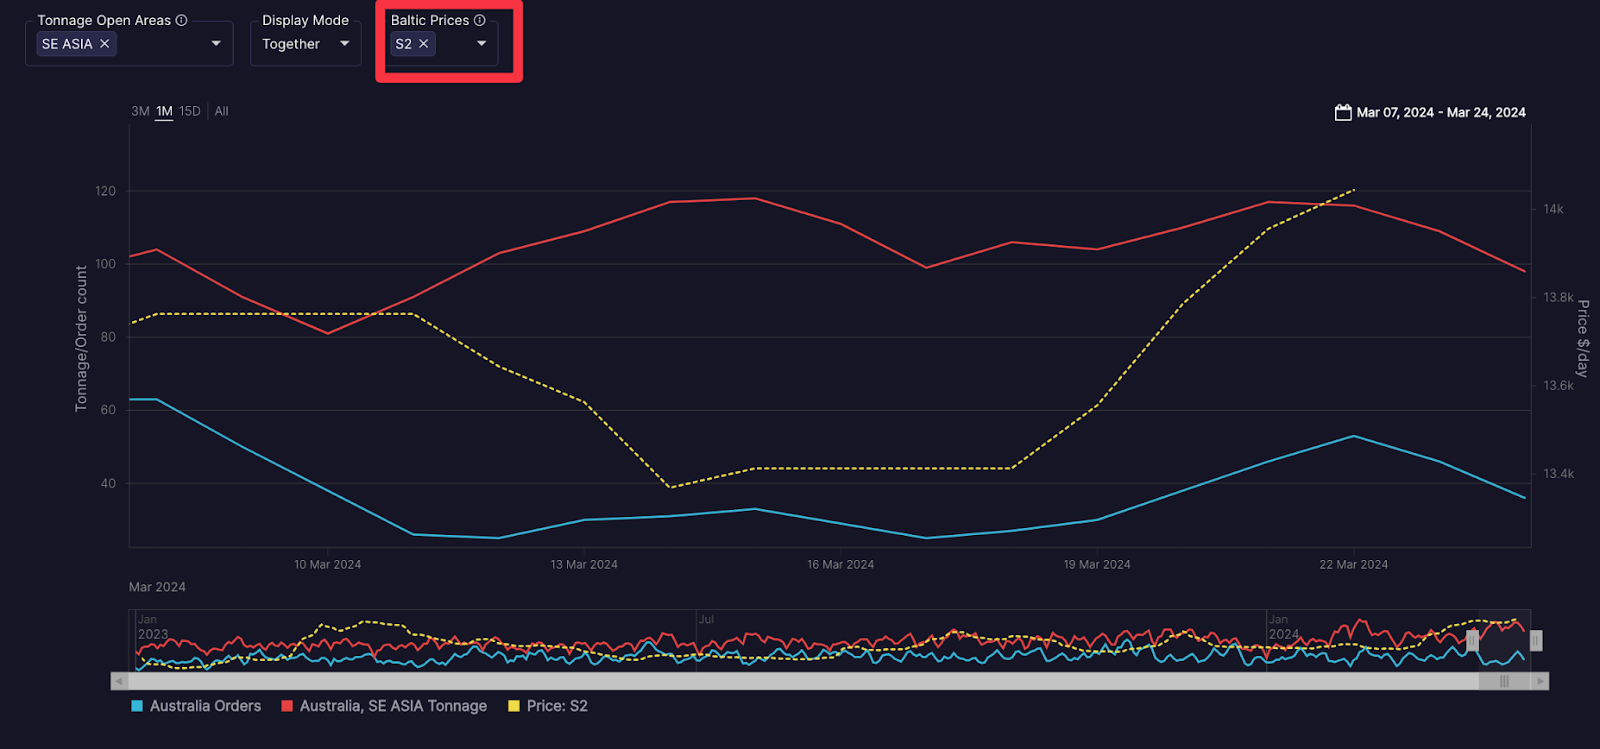
Use the tool below the graph to select which period you would like to see.