Introduction
As part of its plan to reduce the carbon intensity of the maritime industry of all ships by 40% by 2030, compared to 2008, the International Maritime Organization (IMO) has adopted two measures of carbon intensity. These are:
-
The Energy Efficiency Design/Existing Index (EEDI/EEXI)
-
The Carbon Intensity Indicator (CII)
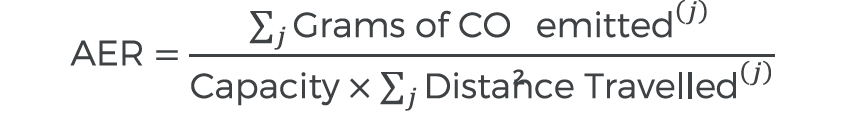
Both metrics take the form of an Efficiency Ratio (ER), which represents the amount of CO2 emitted by a vessel per unit of transport work, as shown in the following formula:

CO2 is measured in grams (g), cargo capacity in metric tons (t), and distance in nautical miles (nm). Therefore, the units of the ER are g CO2 / t nm. There are several different efficiency ratios which are considered in relation to CII. Currently the IMO is favoring the Annual Efficiency Ratio (AER). The term AER is sometimes used interchangeably with CII.
A vessel’s AER is an operational efficiency measure characterized by ratio of the actual CO2 emitted by a vessel and transport work performed, over one calendar year. This is derived from the fuel type, consumption, distance travelled, and cargo capacity. For vessels of 5,000 gross tonnage or larger this information is required to be reported to the IMO’s Data Collection Service (DCS), as of 1st March 2018.
As of January 2023 all Vessels with capacity over 5,000 GT are assigned a ‘Rating’ for every calendar year based on their Attained AER. Those which operate the most efficiently and achieve the lowest AER, are Rated ‘A’, whilst those which perform the worst are Rated ‘E’.
Vessels that are rated ‘D’ for three consecutive years, or rated ‘E’ for one year, are required to complete a corrective action plan in their onboard Ship Energy Efficiency Management Plan (SEEMP to achieve a ‘C’ rating or better in future. Regulation pertaining to the CII can be found in Amendments to MARPOL Annex VI, (Regulation for the prevention of Air Pollution from Ships).
Estimated AER
We are able to estimate the CO2 emissions and distance travelled using vessel specifications and AIS data in combination with the methodology adopted by the IMO in the 4th Green House Gas Study.
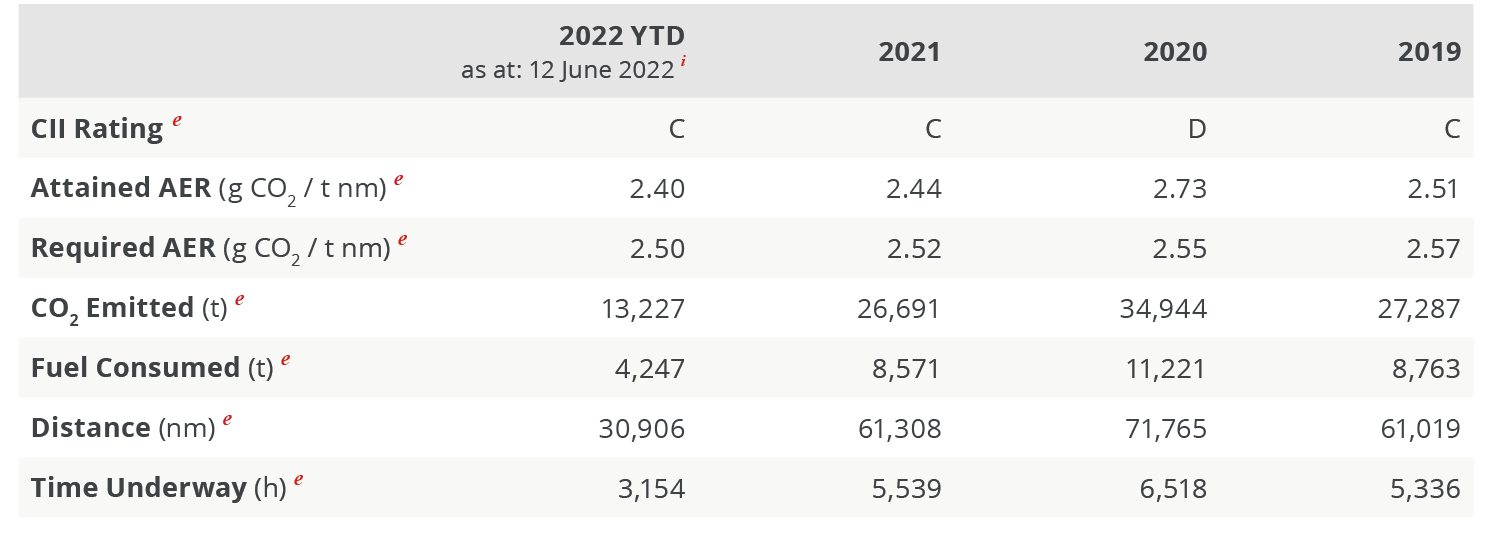
In doing so we are able to estimate the AER of a specific vessel between two points in time and the rating which would apply to that AER at any point in time. We provide the estimated attained AER and rating, CO2 emitted, fuel consumed, distance travelled, and time at sea for the last 3 calendar years. We also provide a figure for the current year to date (YTD), which is updated each time the vessel stops.
We provide the data which is required to calculate the AER to help understand the annual contribution of CO2 and performance drivers of a vessel in relation to CII.
Calculation Methodology
Description and overview
The AER of a vessel is computed within a pre specified time interval (typically one calendar year). It is expected that within the given time window the vessel would have made multiple journeys, here indexed by j. In this case,
In the left equation, the deadweight is constant (vessel specific) while the emissions and the distance travelled are derived from AIS and captain’s report data.
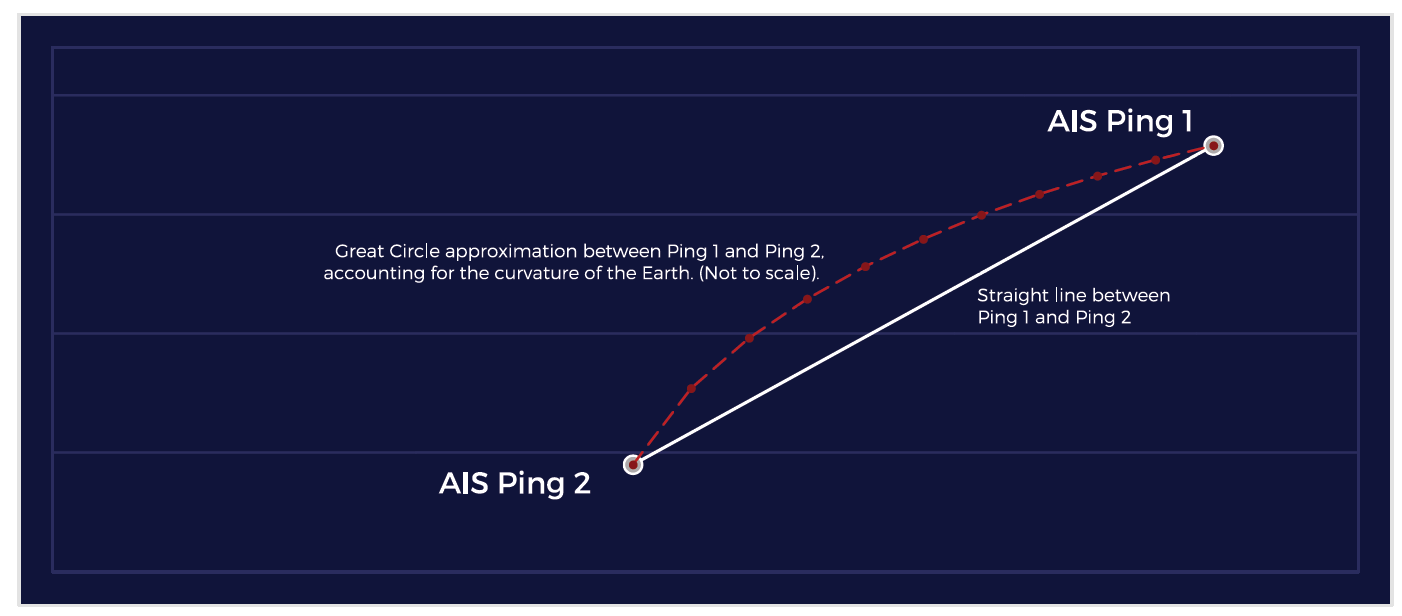
Distance
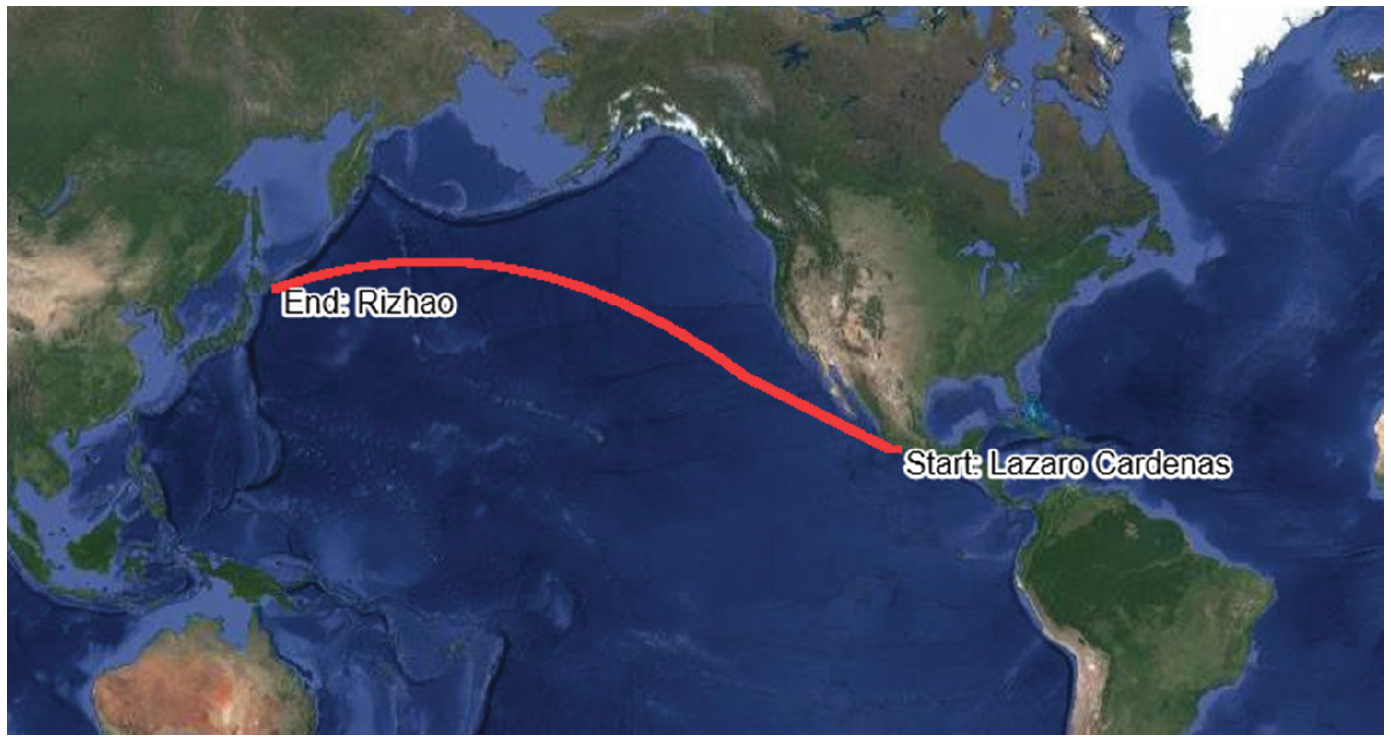
The distance over the journey is calculated as the sum of (great circle) distances between consecutive AIS pings. It is assumed that the frequency of the pings is such that the great circle approximation applies, i.e. the path between any two pings is ‘straight’ (on a sphere).
Emissions
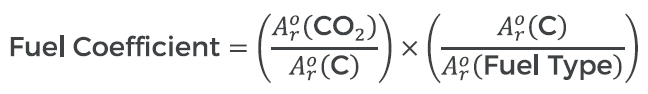
The amount of CO2 emitted over a journey is a simple conversion based on the fuel coefficient of the fuel type (in grams and assuming a fixed combustion regime).

Where,
And ![]()
Main Engine
The fuel used is calculated as the product of the energy used and the specific fuel oil consumption (SFOC), via:

Where both the energy used and the SFOC are calculated on the fly (between any two consecutive pings) from the ship’s instantaneous engine power P. The former is a function of the instantaneous speed V (AIS) and the current draft h (Captain’s report), given by the admiralty formula:
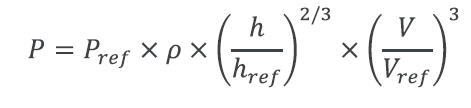
Where ![]()
![]()
With the power P calculated, the energy used between two AIS pings is:

Where ΔT is the time difference between two AIS pings (typically on the order of seconds up to minutes). Finally, the SFOC is also a function of P, namely:
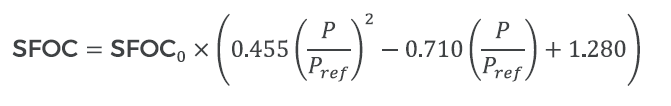
With SFOC0 being an externally specified tuning parameter.
Auxiliary Power
It is assumed that auxiliary engine / boiler power is constant (by ship type, size and activity) along each journey and stoppage. It then follows that fuel is consumed by auxiliary engines at a constant rate. Formally, between two consecutive AIS pings separated by the time interval ΔT

Where in the above Power and SFOC are constant and vessel specific.
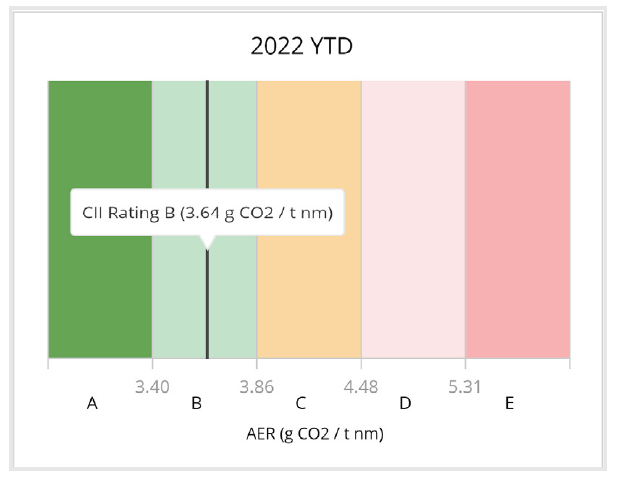
Banding
After the AER is calculated for a specific vessel, it is classified within one of the five bands A - E. The boundaries of the bands depend on the ship type and deadweight, and generally move over time as stricter restrictions are applied in later years. Within a ship type (e.g. Capesize bulker), the reference value is first calculated as:
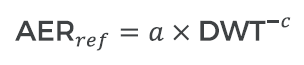
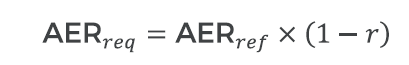
Where a, c >0 are type specific parameters supplied externally. The so called required AER, AERreq is evaluated next:
|
Year |
r |
|---|---|
|
2023 |
5% |
|
2024 |
7% |
|
2025 |
8% |
|
2026 |
11% |
The four boundaries of the five bands (bands A and E do not have lower and upper boundaries respectively) are then computed by multiplying ![]()
![]()
![]()
![]()
![]()
Summary
AER is a ship specific measure of emissions per capacity ton mile of cargo. In contrast with EEDI / EEXI, AER utilizes the deadweight of the vessel, i.e. its maximal carrying capacity, rather than the actual amount of cargo carried.
As mentioned in section 1, AER is typically measured and reported on an annual basis. The quantities required for the computation of AER (other than the vessel’s deadweight) are the total amount of fuel used and the total distance travelled within the time period of interest.
The total distance covered by a vessel within a time window can be calculated from AIS data (GPS). Estimating the total fuel used is more complex and involves AIS data, the vessel’s reported draft, and the performance characteristics of the vessel’s engine. The essential component of the fuel estimation method is the admiralty formula, relating the vessel’s instantaneous speed and draft to the main engine power output. The instantaneous power output estimate is then converted into fuel consumption via the SFOC formula. In our case the admiralty formula is applied between any two consecutive AIS pings, between which the speed of the vessel is assumed to be constant. The other factor contributing to fuel consumption and emissions is the use of auxiliary engines, which are currently modelled as consuming fuel at a constant rate (zero when off or strictly positive otherwise).
Data Methodology
Using a combination of data relating to Vessel Movement and Specification we are able to estimate the amount of CO2 a vessel will have emitted in order to carry out the activity we have observed in accordance with the features of that vessel. We update our records each time a vessel starts moving with the information relating to the vessels activity since the last time the vessel stopped. As such we are able to report the
estimated fuel consumption, CO2 and AER for each vessel in almost real time.
Vessel Movement
We are able to determine the position, course, time, distance, draft and activity of any given vessel using data from the Automatic Identification System (AIS). These are the same data which drive our Trade products.
Data Cleansing
Due to the nature of the AIS signal, it is prone to errors. VesselsValue has extensive proprietary preprocessing algorithms to identify and exclude erroneous records. For example, if a pair of AIS positions would require a vessel to travel faster than its rated speed, then the position is discarded. This step is vital to ensuring the accuracy of our estimates.
Derived Information
Using a combination of AIS signal and subject matter expertise we are able to determine additional information about a vessel which is not contained within the raw signal.
Speed
We are able to determine the distance between AIS pings and the lapsed time. It is therefore trivial to calculate the average speed of the vessel between two AIS pings. While it is possible to perform this calculation over any time interval the higher the time interval the less accurate the CO2 estimate due to
the relationship between speed and fuel consumption.
Draft
The Draft of a vessel is often temporarily misreported, for example being reported late when leaving port. In order to minimize this potential source of error we use the modal draft to ensure that our processes are not adversely impacted by temporary misreporting. As such we are able to reliably determine the extent to which each vessel is laden and how much cargo was loaded or discharged during cargo operations.
Activity
Using a combination of position, speed and draft, we are able to determine what activity a vessel is undertaking when it has stopped. We are able therefore to differentiate between a vessel which is engaged in activity with high auxiliary power usage, such as cargo operations, and activity with low or no auxiliary power usage such as idle or laid up respectively.
Estimation Uncertainty
As with any estimation method the VV CII Estimation process carries a level of uncertainty. Due to the complexity and scale of the problem being solved there are several potential sources of error. We have sought to minimize these potential errors by;
-
Using data from trustworthy sources.
-
Verifying data from multiple sources.
-
Identifying and removing outliers.
-
Using established methods for deriving data.
-
Verifying outputs with subject matter experts.
-
Implementing known physical limits.
-
Conducting technical error propagation analysis.
We are currently unable to verify our outputs against an independent data source due to the lack of publicly available emissions data, for example data reported to the IMO DCS or noon reports. Should these data become available, we will compare them with our model outputs and report the accuracy.
Conclusion
Reducing carbon emissions to combat climate change is a global challenge common to all industries. The maritime industry is facing this challenge head on with innovative technological solutions, including energy saving devices, new design specifications and alternative fuels. Additional regulation will undoubtedly play a
significant role in the forthcoming change. Understanding the contribution of any individual vessel, or fleet, to maritime CO2 emissions will be vital in navigating this significant period of change in the industry. As with any change there will be challenges and opportunities arising from the energy efficiency of a vessel or fleet. Those best able to understand and monitor performance will have the highest chance of taking opportunities and avoiding risks.
Glossary
|
Abbreviation |
Name |
Description |
|---|---|---|
|
CII |
Carbon Intensity Indicator |
The metric used by the IMO to measure operational efficiency. |
|
ER |
Efficiency Ratio |
A ratio used to measure the efficiency of ships, found by dividing CO2 emissions by transport work performed. |
|
AER |
Annual Efficiency Ratio |
The Efficiency Ratio of a single vessel over one calendar year. |
|
DCS |
Data Collection Service |
The platform used by the IMO to collect fuel consumption/ emissions data for individual vessels. |
|
SEEMP |
Ship Energy Efficiency Management Plan |
A listing of measures taken to improve energy efficiency, as well as the input parameters and final calculated CII. |
|
RO |
Recognized Organization |
A surveyor, or other organization, entrusted by a vessel's flag state with verifying a CII calculation. |
|
SoC |
Statement of Compliance |
A certificate awarded to vessels which are deemed
|
|
MEPC |
Marine Environment Protection Committee |
The body addressing environmental issues under the IMO's remit. |