Fixed Age & Newbuild Value
Fixed Age Value
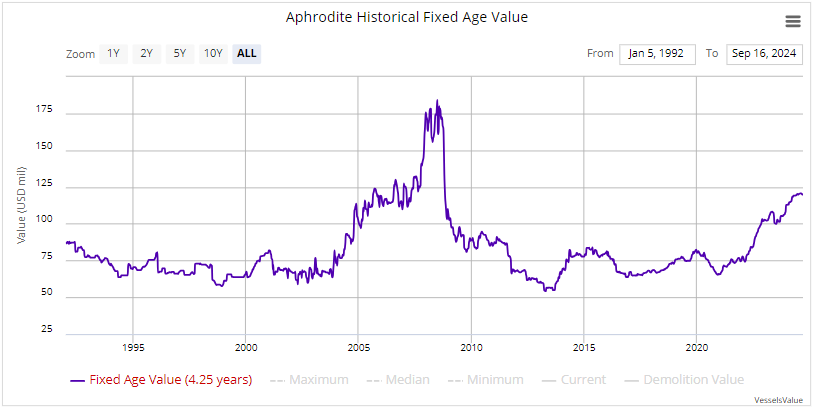
Fixed Age Value is the historical value of the vessel with its current features and size, adjusted to an equivalent historical specification using its age as of the valuation date. This represents a historical value with the influence of age removed.
Newbuild Value
The Newbuild Value is the amount in USD millions for which a vessel could be bought today with modern equivalent specifications. Sometimes called the ‘Replacement Value’, it represents the assumed cost a shipyard would quote a buyer for a vessel today up to -3 years old.
The year in which the vessel in question is built is a key factor in determining how the value is calculated. This is because the Newbuild Value is calculated as a ratio of the vessel in question vs the industry standard type built in the same year.

Fixed Age Analysis
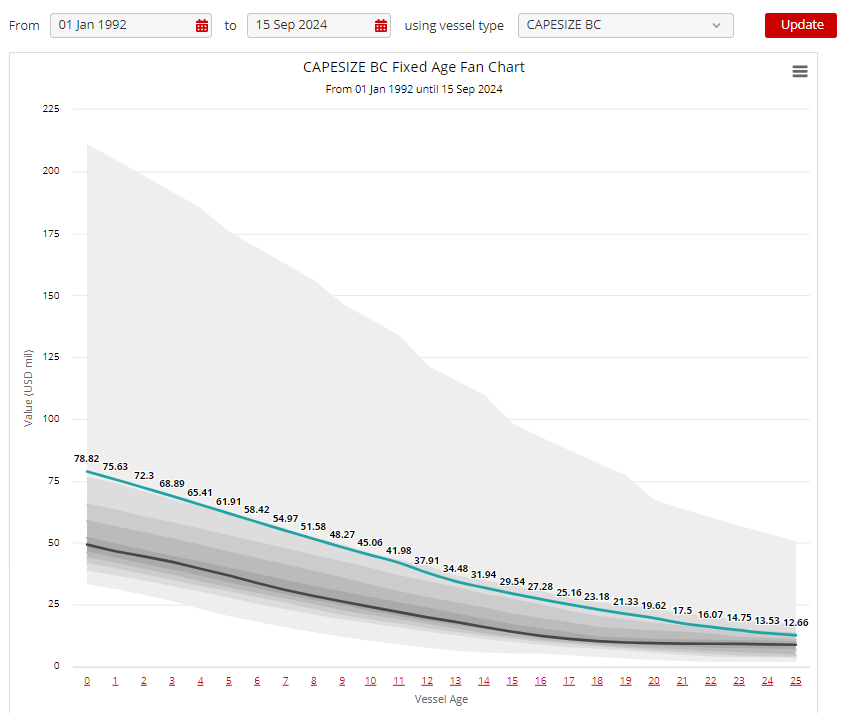
The Fixed Age Analysis Fan Chart shows the historical distribution of market values of a vessel of the selected ship type at each year of age for the selected period. The distribution of values are grouped into deciles to indicate the statistical probability of a vessel of that age having a value in that range. The median, current values, or historical values can be overlaid by clicking on relevant chart legends.
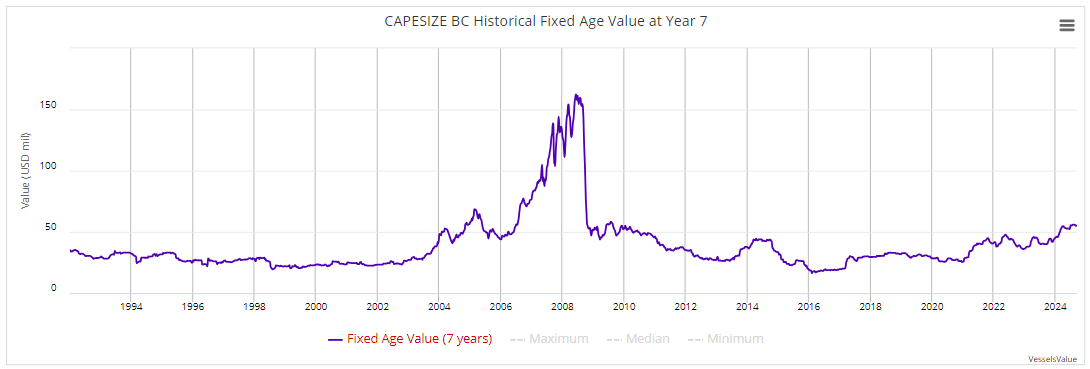
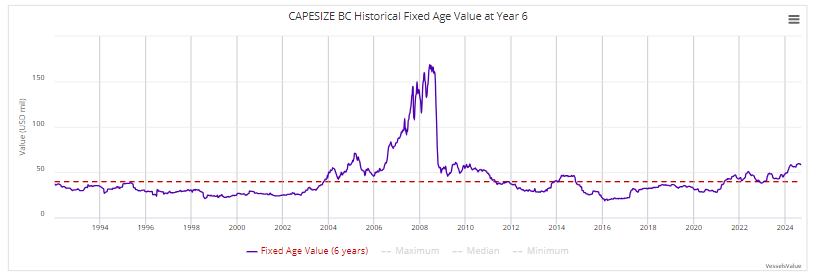
By clicking on the age on the horizontal axis of the graph you can see the fixed age values for the standard vessel which are producing the distribution shown for that age.
Industry Standard Specifications
The standard vessels, which the Fixed Age and Newbuild calculations use, are represented in the Matrix for that vessel type.
Fixed Age Analysis
The Fixed Age Analysis (FAA) module is an interactive tool that shows the historical distribution of market values of a vessel of the selected ship type at each year of age for the selected period. The distribution of values are grouped into deciles to indicate the statistical probability of a vessel of that age having a value in that range. The median, current values, or historical values can be overlaid by clicking on relevant chart legends.
Functionality
The user selects the vessel type (i.e. Capesize, VLCC, Feedermax, VLGC etc) and the historical period to be analysed. The charts display the relevant data in an interactive form. There are two charts showing different versions of the analysis; a fan chart, to which is appended a loan tranche calculator, and a heatmap.
The fan chart shows
The historical frequency of values for fixed age vessels of the selected type, broken down by vessel year of age (in years) and grouped into deciles (10 percentiles)
The historical median for each age of vessel and time period selected
The current values and preceding years values (as per 1st Jan of each year) for each age of vessel.
The Loan Tranche Calculator also allows the user to input and overlay one or more loans against the historical value distribution. This can be used for assessment of the potential asset value risk of a vessel purchase or financing. The decile information could be used by portfolio managers to get an idea of their future exposure at a pre-set level of confidence. Please see an example below for illustration purposes.
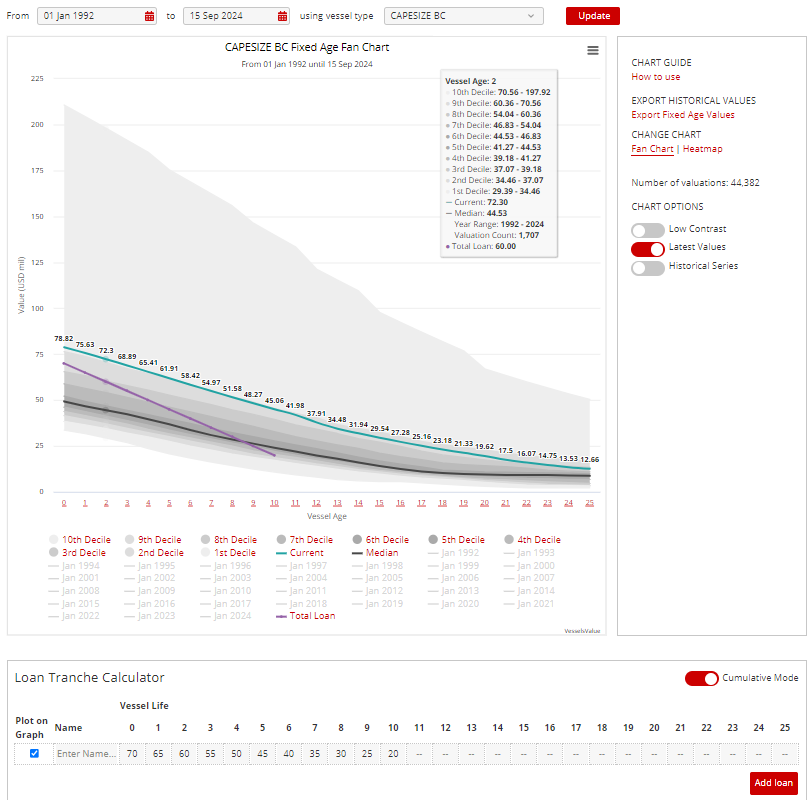
By clicking on any one year of age on the horizontal axis of the fan chart, the user can automatically display the price development of a vessel of that fixed age, since 1992, soon earlier, against the loan outstanding of the year (the dotted line). This allows the user to immediately get an historical perspective of a loan outstanding or balloon.
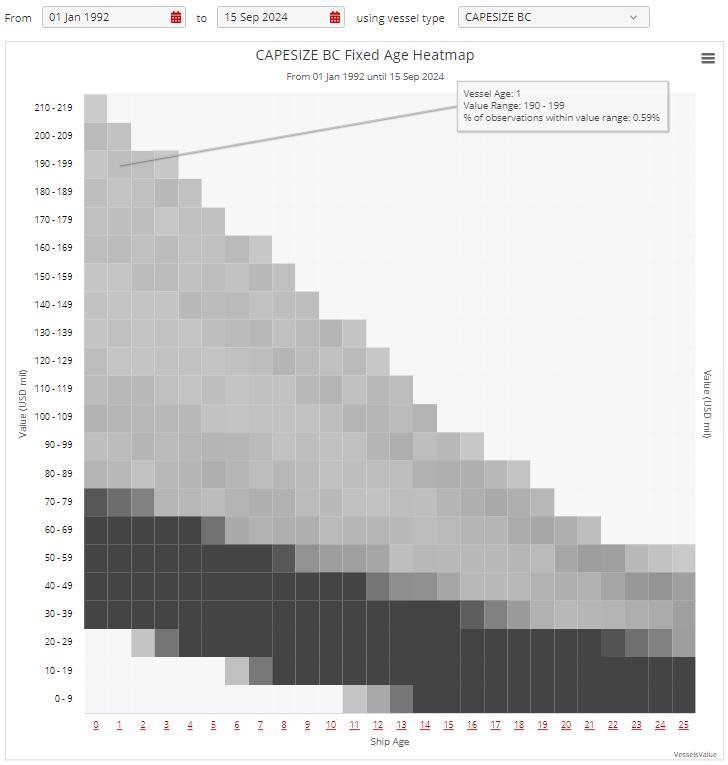
The heatmap shows
The same data as the fan chart but displayed as a heatmap
The historical frequency of values are grouped into cells which are defined by the vessel age and value range, the darker the shading of the cells, the higher the relative number of historical values within the specified value ranges
