The Mathematics of Market Value
The development of an automated valuation system driven by market data requires two main ingredients. The first is a database of the highest quality and the widest coverage. The second is a mathematical model that incorporates the necessary broking intelligence to ensure valuations consistent with economic realities.
Introduction
Economic modelling is not a game for beginners. Markets are composed of diverse participants interacting in complex ways. This gives rise to volatility and unpredictability. Nowhere is this truer than in shipping, where high volatility and “asset play” are the norm, indeed for many the raison d’être, and deals are often shrouded in secrecy and misinformation.
The unenviable task of valuing vessels amid this chaos and darkness has traditionally fallen to shipbrokers, who use a combination of experience and recent transactions to estimate the price a vessel might achieve between a hypothetical buyer and seller. There is much art to this process and no guarantee that two brokers will form identical opinions on the same vessel.
The development of an automated valuation system driven by market data therefore requires two main ingredients. The first is a database of the highest quality and the widest coverage. The second is a mathematical model that incorporates the necessary broking intelligence to ensure valuations consistent
with economic realities.
What Value?
First, we must specify what we mean by “value.” This is a somewhat contentious matter and the subject of much debate in the academic and industry press. Traditionally, market value is defined as the sale price a vessel would be expected to achieve in a transaction between a willing buyer and willing seller under certain standard assumptions about the vessel’s condition and legal status. Our analysis, which covers the entire lifetime of a vessel, enables us to incorporate newbuilding value, replacement value and demolition value into the model of market value which is the focus of this document.
Other values are possible, especially those used in accounting. Discounted Cash Flow (DCCF) value is the net present value of the vessel’s future cash flows, comprising freight earnings, operating costs, maintenance, and demolition. Book value records straight line depreciation. We offer automated DCF and Linear values, whose methodology documents are also available.
Transactions
The primary sources of data regarding vessel values are the sale and purchase (S&P) and newbuilding markets. Although there is no official record of orders and sales, information filters through the network of builders, buyers, sellers, and brokers before finding its way into commercial reports, company press releases
and the industry’s news media. This process is somewhat haphazard and accounts of transactions do not always agree. We use our broking experience and analytic techniques to collect and verify this information to produce a database of orders and sales of unrivalled coverage and accuracy.
When a sale includes an additional contractual term, such as a charter, this will have an associated value (possibly negative) on top of the market value of the vessel itself. Such transactions must be handled with care. Reliable information about ongoing negotiations can be used to ensure valuations keep pace with market developments, but again caution and in-depth market knowledge are required.
Five Factor Model
The academic literature and our own studies indicate that a commercial vessel’s value can be explained in large part by five factors. These are Type (e.g. VLCC, Capesize, QMAX, AHTS), Features (e.g. shipyard, hull, gear), Age, Size, and Earnings.
Type
The shipping market is highly segmented. Vessels carrying different quantities of different cargoes on different routes or performing specialist functions are governed by different economics. These segments are reflected in the naming conventions (VLCC, Suezmax, Aframax, PSV etc.) applied to vessels based on size, cargo, function, and their ability to negotiate certain canals, ports or maritime environments. Although long term trends may be common to all segments when they are linked to global economic factors, such as the inflation and collapse of the asset price bubble of 2008, spot issues relating to particular cargoes or routes can make short term trends uncorrelated. Therefore, our model delineates ship types which are treated independently.
Features
The global commercial fleet exhibits great heterogeneity, particularly among smaller vessels running more specialized trades. A vessel’s features and specification have a significant effect on its value. For example, an
Aframax with coated tanks capable of accepting refined products will, ceteris paribus, command a premium over an Aframax that can carry crude oil only. Similarly, buyers will pay more for a vessel built at the most reputable yards than for a similar vessel whose keel was laid by a less established builder.
The differences in value resulting from these multifarious features are a sophisticated part of the shipbroker’s art, and there are many more permutations than can be analyzed algorithmically from the information available. Therefore, our brokers and analysts have used their knowledge and experience alongside numerical techniques to assign scores to all the features recorded in our vessel database.
Age
The effect of age on a vessel’s value is not a simple matter of depreciation by a fixed amount or percentage. A vessel has a build period followed by finite but uncertain lifetime over which to generate earnings, after which its value is that of its scrap steel. Values at launch may be higher or lower than the order price for a similar vessel depending on market conditions. The difference in value between a brand new vessel and a sister built the year before is generally small, because the extra earnings are uncertain and far in the future. This implies gentle depreciation over the first few years. The difference between such vessels as they age increases, before both values level off at scrap. The precise depreciation profile will depend on market
conditions. Other factors, such as design improvements and supply/demand differences for vessels of particular ages, also come into play.
Size
Most commercial vessels earn money by carrying cargo, so their value depends on the amount of cargo they can carry. We refer to this as size. Typically, it is measured in deadweight tons (DWT) for tankers and bulk carriers, twenty foot equivalent units (TEU) for containerships, and cubic meters (CBM) for gas carriers. Vessels which earn money in different ways, such as Offshore Tug and Supply units, have different notions of size indicating their capacity to do remunerative work. For example, an anchor handling tug has its size measured in brake horsepower (BHP).
Even within a type, a vessel’s value does not increase in direct proportion to its size. Chartering practices mean that there is often an optimal size for each type of cargo vessel, such as 180,000 DWT for a Capesize bulker. Vessels smaller or larger than this will be less valuable per unit size because, for example, they cannot accept a full load at some ports or they have the burden of spare capacity to transport.
We model the inherently nonlinear dependences of value on age and size using flexible mathematical functions. These have adjustable parameters which allow them to assume a wide variety of shapes, within
sensible limits imposed by commercial principles and broking expertise.
Earnings
That vessel values are correlated with earnings rates (usually measured in USD per day) is a well established principle within the industry. It makes sound economic sense. However, finding the best proxy for market sentiment from the plethora of published earnings rates is far from straightforward. Indeed, some sectors do not have well publicized rates and other indicators may be used. Even when appropriate data have been chosen, considerable signal processing is still required for accurate modelling. Spot rates contain much irrelevant noise and must be smoothed. Values react to movements in the chartering markets, so a lag must be applied. Furthermore, it is essential to characterize how the newbuilding and sale & purchase markets react not only when earnings are close to their historical averages, but also when they are unusually high or low. We have studied the variation of vessel values with earnings rates over recent decades, including
the rollercoaster of 2007-2009, to determine relationships valid even at the extremes. Judicious selection and processing of data allow us to achieve very high correlations between values and earnings signals for most vessel types. Models and assumptions are actively managed to ensure consistency with market developments.
Adaptive Modelling
Access to reliable information on orders and sales is a critical aspect of valuation, and experience has taught us that the most accurate way to determine values depends on how much information is available. Orders and sales are recorded far more frequently for some ship types than for others, and these frequencies are themselves subject to fluctuations. Consequently, our analysis begins with an automated count of transactions in order to classify ship types by their volumes of recent sales as liquid, semi liquid or illiquid.
These categories determine the method of valuation that is used.
If a ship type is liquid, second hand values can be determined primarily from sales data, while order prices establish newbuilding values. However, matters are more complex for illiquid ship types and our model adjusts for them in two ways. Firstly, greater use is made of the effect that order prices have on the longer term value of an asset. Secondly, we supplement actual sales with automated data. These automated prices are inferred from comparable ship types that are liquid, and they are applied to the notional sale of a vessel at key points in its working life.
The more recent a transaction, the greater its influence on current prices, hence the importance in shipping of the ‘last done’ deal. The strength of this effect will vary according to market conditions. Our model adapts to these conditions by taking account of the sales liquidity and price variability of each ship type to determine the influence of the recentness of an individual data point on valuations.
.png?inst-v=0776b397-f333-4686-b633-a7828f332c6e)
Figure 1. Surface plot of value against age and deadweight for a Handy bulker with standard features and fixed earnings.
Algorithms
Having established how to model the five factors, the next step is to use actual transactions to calibrate the model. Specifically, the parameters which determine the shapes of the mathematical functions for age, size, and earnings are adjusted to match the orders and sales data as closely as possible. Finding these best fit relationships requires mathematical and computational techniques known collectively as regression
analysis.
Straight line regressions can be performed with minimal expertise in popular spreadsheet packages. However, these are not suitable for our purposes since our relationships are nonlinear (curved). In fact, our relationships are not lines at all, straight or curved. Rather they combine to form multidimensional surfaces, with one dimension for each of value, age, size, and earnings. Figure 1 shows an example surface obtained by fixing one of the variables (earnings) at a constant level, in this case for Handy bulkers.
One difficulty is that the relationships which combine to form these surfaces can’t be determined independently. It is impossible to use sales data to find only the age relationship if we are unable to adjust the prices for size, but we can’t obtain the size relationship we require from sales without first being able to adjust for age. We are trapped by circularity.

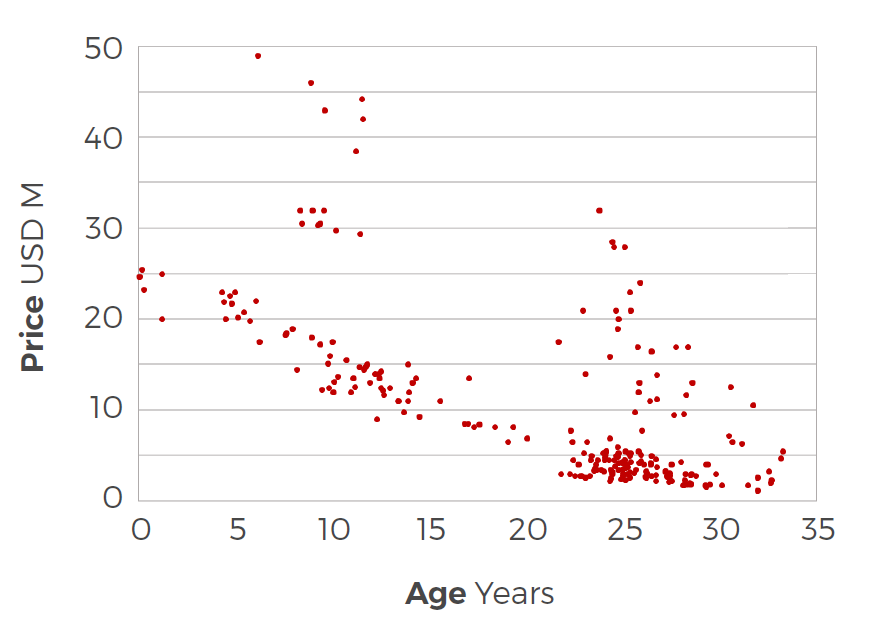
Figure 2. Historical sales of Handy bulkers over a three year period plotted against vessel age.
To illustrate this problem, Figure 2 shows historical sale prices of Handy bulkers over a three year period plotted against vessel age. Some sales took place before the 2008 crash at high prices, while the remainder occurred afterwards at more modest levels. Confounded by the wide range of market conditions present on this graph, not to mention a variety of sizes and features, it would be hard to plot a single meaningful curve through this data.

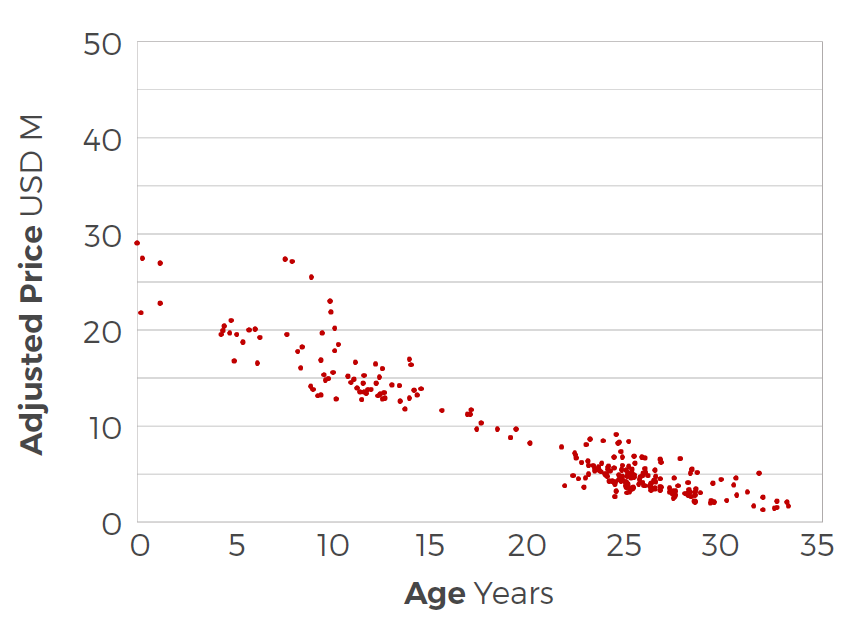
Figure 3. Sales from Figure 2 adjusted for features, deadweight, and earnings.
In this case the solution is to find the relationships simultaneously. Figure 3 shows the sales from Figure 2 after adjustment for features, size, and earnings. A much stronger relationship between sale price and age is now evident.
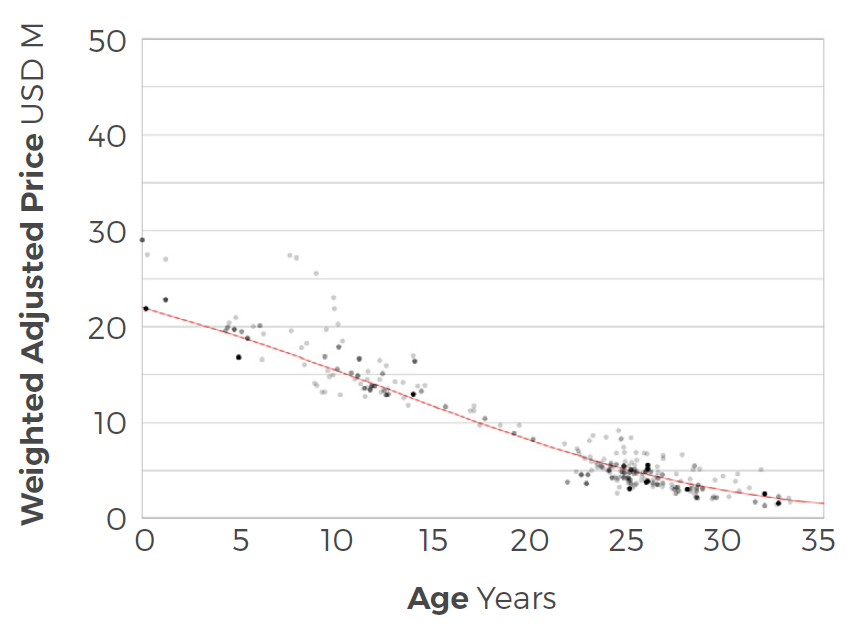
In practice, the more recently a sale occurred the greater its influence is likely to be on current values. We model the impact of a transaction within the valuation algorithm using a technique known as weighted regression, enabling a best fit curve to be determined. This is illustrated in Figure 4 where the weight applied to each individual sale is depicted graphically by the tone of the data point.

Figure 4. Data from Figure 3 with regression weights shown graphically (grey) and best fit curve (blue).
Complexity
Our valuation process is a network of interconnected procedures so we refer to it at VV as the Market Value System. The daily routines begin by updating a comprehensive set of statistics. Regressions are then carried out to value liquid ship types and, following this, regressions to value illiquid types. Values for semi liquid types are obtained from a combination of liquid and illiquid methods. The final market value of each vessel is computed taking account of its demolition value.
Applying a system of such complexity requires advanced regression techniques and sophisticated optimization algorithms along with methods of process control and database management that are well beyond the capability of standard spreadsheet packages. We have built a team of modelers, quantitative analysts and software developers to build, test, and refine a bespoke computer program to perform this analysis.
Accuracy
Our customers are sophisticated market participants who insist on understanding the methodology behind our valuations. But what they are really interested in is accuracy, because that is what affects their bottom line. This is where our system is truly unique. We value every vessel every day. This means we can compare our valuation from the day before a sale with the actual price achieved. Transactions in circumstances unreflective of market levels are excluded. Unlike a human, our software has no hindsight, making this a true test of how the system performed. Crucially, this allows us to measure our accuracy. Currently we are unaware of other valuators offering this.
We regularly report the results of these tests in our Market Value Accuracy Report. The analysis shows the frequency distribution of the percentage difference between the model value and the realized sale price. It gives us confidence that the model has no systematic bias and has strong predictive power.
It is worth remarking that ‘difference’ is not the same as ‘error’. Although it would be hubris to claim that our valuations were entirely free of errors, there are many reasons why a valuation might differ from the actual sale price. For example, the vessel may have been in especially good or bad condition. Furthermore, not all transactions are equally advantageous for buyer and seller and occasionally there are bargains to be had on both sides. Therefore, a certain amount of variability will always be present. But what an automated valuation system offers, which a human cannot, is the ability to measure objectively the accuracy of the values it produces.
The ability to measure accuracy has another important role in the development of the model. We can set certain model parameters and calculate the historical values that this setting would have produced, then we can reset the parameters and recalculate the values. By comparing accuracy, we can optimize parameter settings. We call this powerful developmental tool ‘back testing’.
The Future
Artificial Intelligence (AI) can be described as the creation of intelligent machines that behave like humans. This field of computer science, underpinned by mathematical analysis, is affecting many aspects of life. In the world of finance, the early computerization of banking and markets led to advances in cryptography and algorithmic trading. More generally, applications of machine learning abound from speech recognition and the interpretation of medical imagery to programs that play games like chess, shogi and go to superhuman standards. Automated valuation models are now commonplace for valuing real estate. Early concerns about their ability to cope with changing market conditions are no longer an issue.
We believe that AI is beginning to have a profound effect on shipping, on the financial management of the business as well as on the design and operation of the vessels themselves. Automated valuation has inherent advantages over manual methods, not least the ability to process enormous quantities of data in a rigorous and scientific way, and to produce instant, up to date valuations of vessels. Our software is run daily so that our model is continually recalibrated to reflect the latest fleet, orders, sales and earnings information. This helps our customers stay abreast of market developments. But we also believe that technology which ignores human knowledge and experience is dangerous, which is why we take great care to ensure that our methods are firmly rooted in broker expertise.
