IMOS X - Voyages
The Voyages workspace in IMOS X lets you quickly view and navigate through your voyages, track their current status, and see how the voyage's results are trending.
Voyage List
Voyages are sorted by Recently Updated by default, but you can choose to sort by Commence Date. You can filter the voyage list by status (Commenced, Completed, Scheduled, Forecast, Canceled, or Closed). You can choose to view voyages Assigned to anyone or assigned to you.
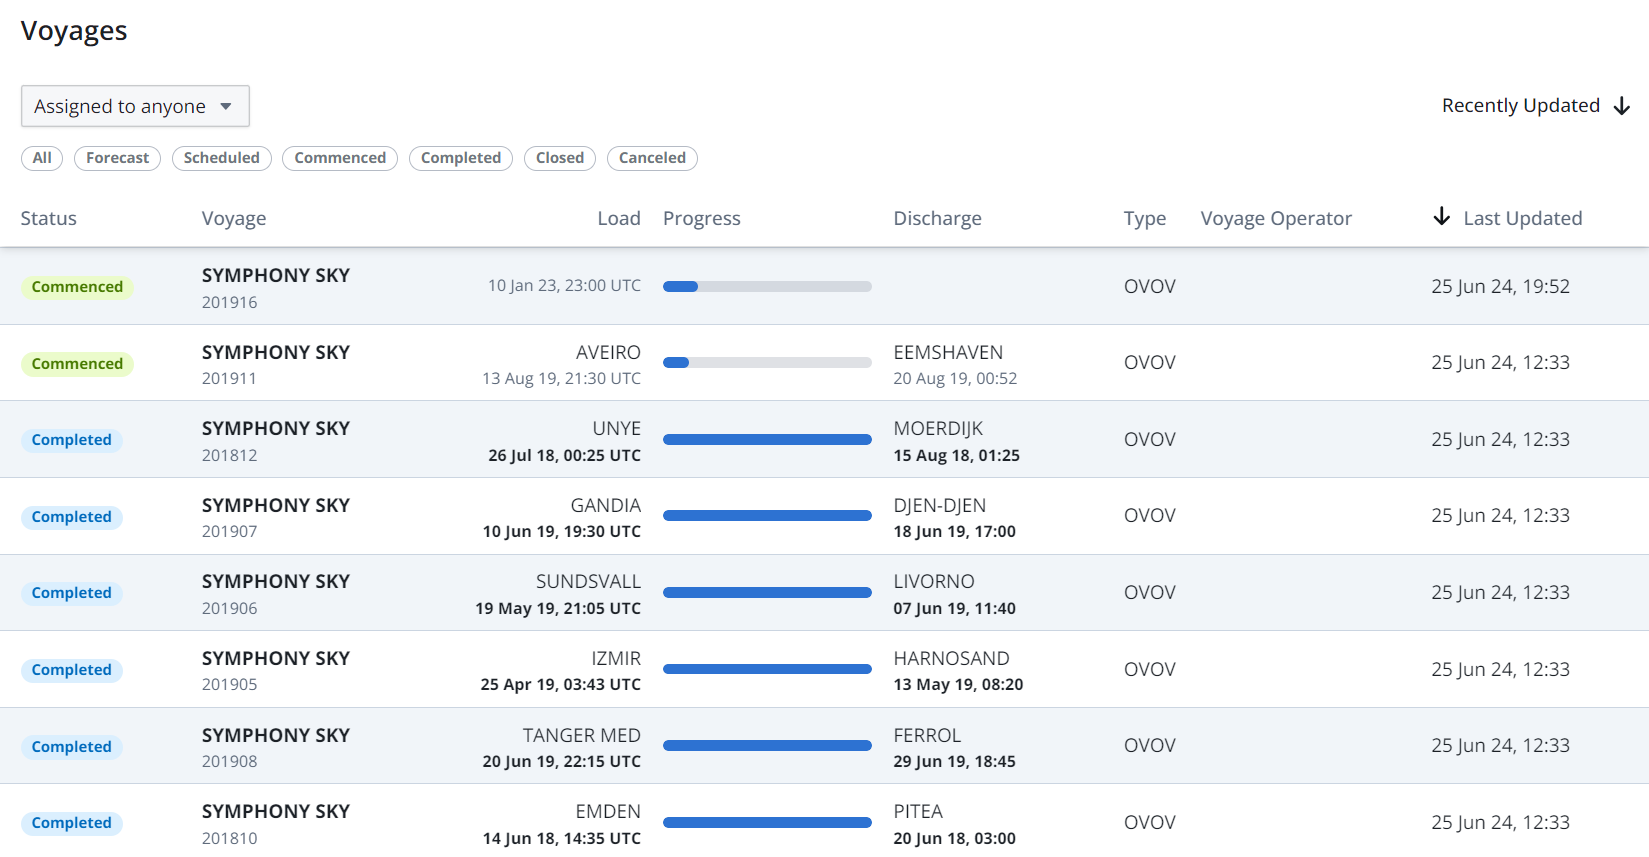
Voyages List in IMOS X
Overview
Select a voyage to see the full itinerary. The Overview section describes the voyage from the first to the last port. The itinerary shows the vessel’s current location and upcoming ports.
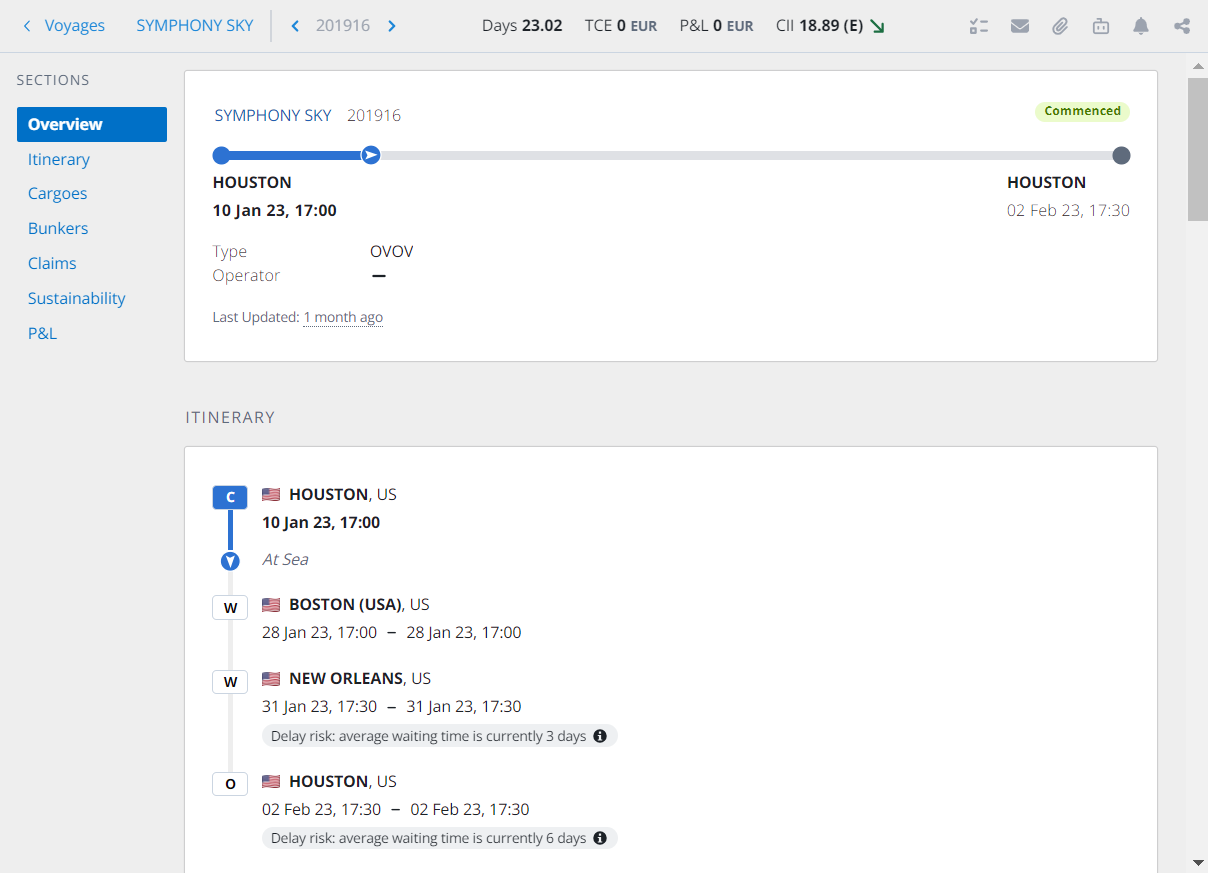
Voyage Overview in IMOS X
Itinerary
The progress bar reflects the progress made on the itinerary as determined by the Arrival Notices, Departure Notices, and/or Noon Reports, as well as the total voyage days.
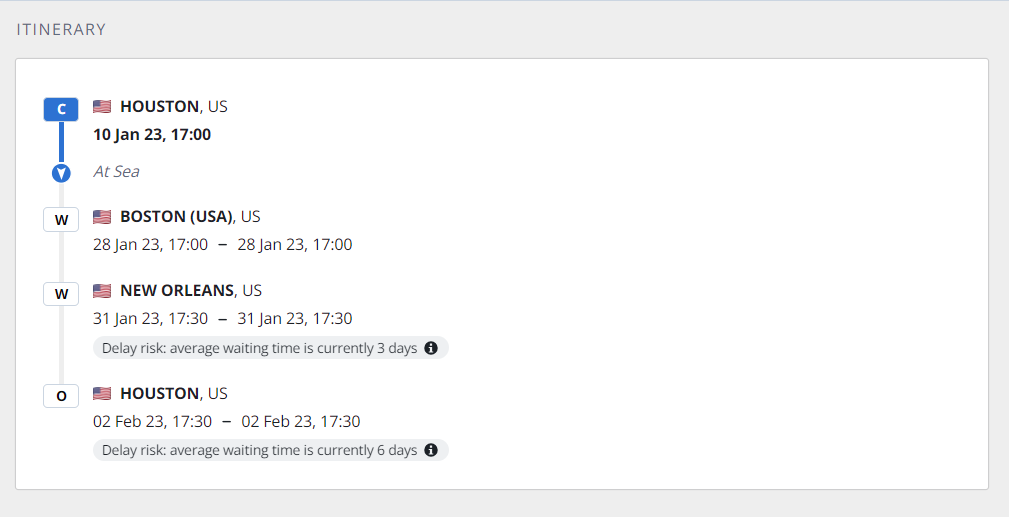
Voyage Itinerary in IMOS X
Voyage KPIs
For TCOV, OVOV, TCTO, or OVTO voyages, you can view the following KPIs at the top of the page: Days, TCE, P&L, and CII KPIs.

TCOV, OVOV, TCTO, or OVTO Voyages KPIs in IMOS X
For VCOV, SPOT, or RELT voyages, you can view the following KPIs at the top of the page: Days, P&L, and CII KPIs.
Days KPIs
Select the Days KPI to show additional metrics that are pulled from the voyage, including Ballast Days, Laden Days, Idle Days, Port Days, Gross Days, Off Hire Days, and Net Days.

Days KPIs in IMOS X
TCE KPIs
Select the TCE KPI to show additional metrics that are pulled from the voyage, including Total Freight Revenue, Total Demurrage Revenue, Total Misc. Revenue, Total Port Expenses, Total Bunker Expenses, Total Misc. Expenses, Voyage Result (total P&L), and Net Days.

TCE KPIs in IMOS X
P&L KPIs
Select the P&L KPI to show additional metrics that are pulled from the voyage.
You can view the following metrics for TCOV, OVOV, TCTO, and OVTO-type voyages: Total Revenue, Total Expenses, and Running Costs.

P&L KPIs in IMOS X
For VCOV or RELT-type voyages, you can view the following metrics: Total Freight Revenue, Total VC In Freight Expense, Total Demurrage Revenue, Total VC In Demurrage Expense, Total Misc. Revenue and Total Misc. Expense.
For SPOT-type voyages, you can view the following metrics: Total VC In Freight Expense, Total VC In Demurrage Expense, Total Misc. Revenue and Total Misc. Expense.
CII KPIs
Select CII to view the Distance, CO2 Emitted, and CII rating for the voyage.
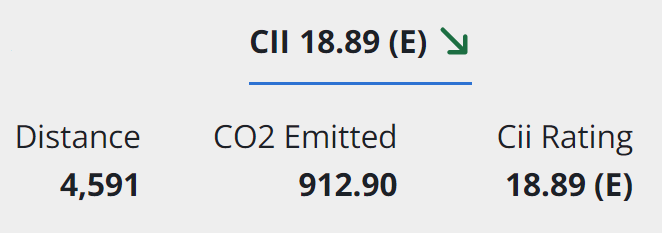
Voyage CII metrics in IMOS X
Port Congestion
Select the info button ![]() by a port in the itinerary line to view the port congestion summary, including the average days waiting, vessels waiting, and congested tonnage. Select the arrow icon to expand the commodity breakdown.
by a port in the itinerary line to view the port congestion summary, including the average days waiting, vessels waiting, and congested tonnage. Select the arrow icon to expand the commodity breakdown.
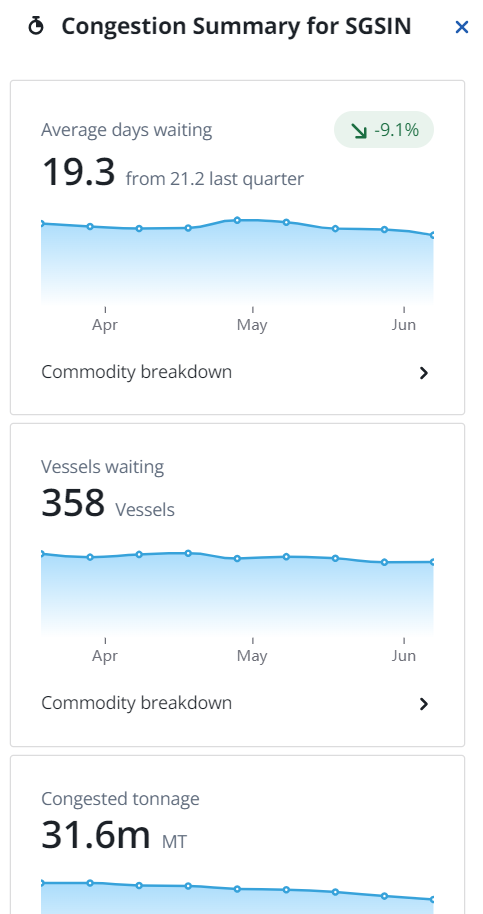
IMOS X Port Congestion Summary
Cargoes
If the voyage has cargoes, the Cargoes section shows the cargo on the voyage.
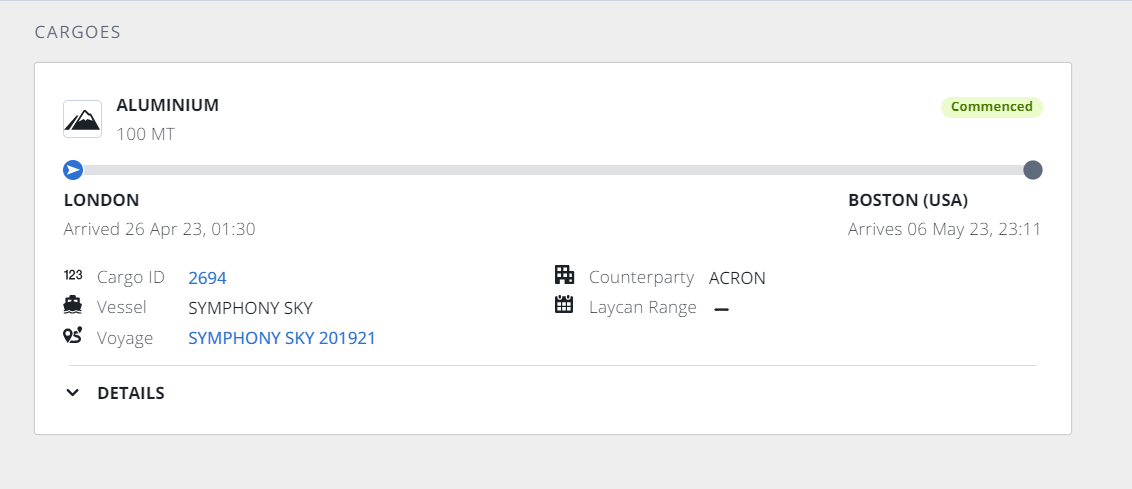
Cargo card in IMOS X Voyages
Each Cargo card contains the following information:
Cargo Name
CP Qty
Status
Cargo ID
Counterparty
Laycan Range
Load Port
Actual or Estimated arrival time at the port
Warnings if the vessel’s scheduled arrival is outside of the laycan window
Discharge Port
Actual or Estimated arrival time at the port
Progress Bar: specific to when the cargo is loaded on board the vessel; shows the progress of that specific cargo from when it is first loaded to when it will be discharged
Bunkers
You can view the following bunker information for TCOV, OVOV, TCTO, and OVTO voyages:
A consumption summary graph showing the actualized and/or estimated consumption of the vessel over the length of the voyage for each fuel type
Average Price of each fuel type
Total consumption quantity per fuel type
Stem quantity per fuel type
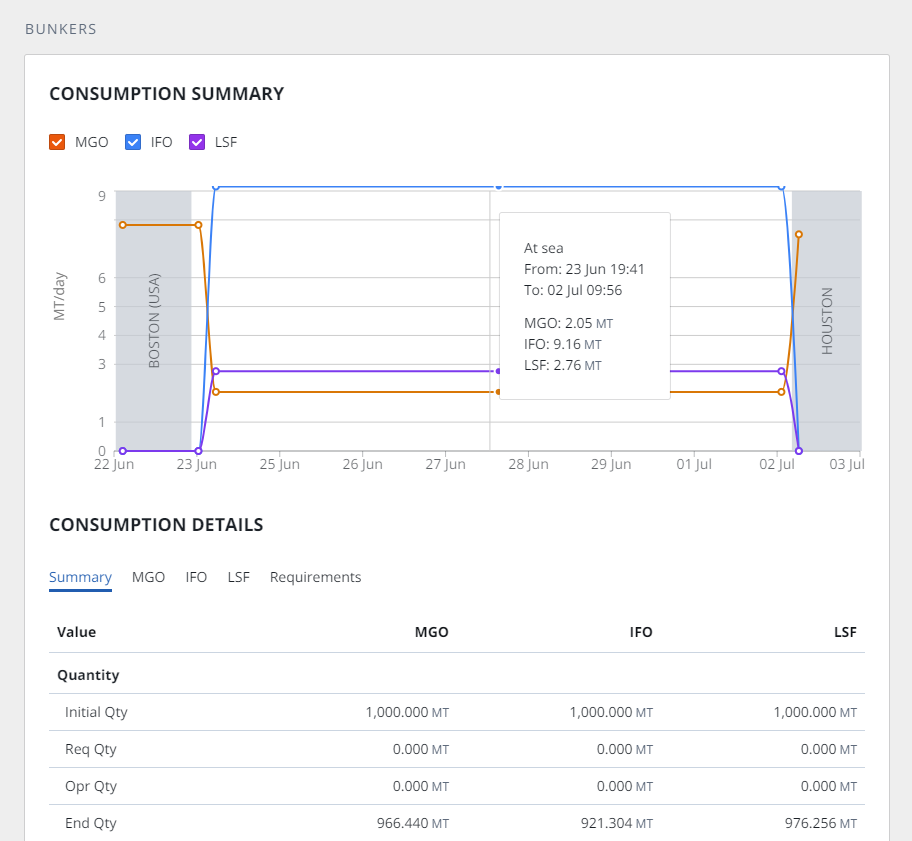
Bunkers card in IMOS X Voyages
You can also access the Bunkers workspace in IMOS X for additional details.
Sustainability
In the Sustainability section, you can assess voyage emissions, including fuel consumption for each leg of the voyage.
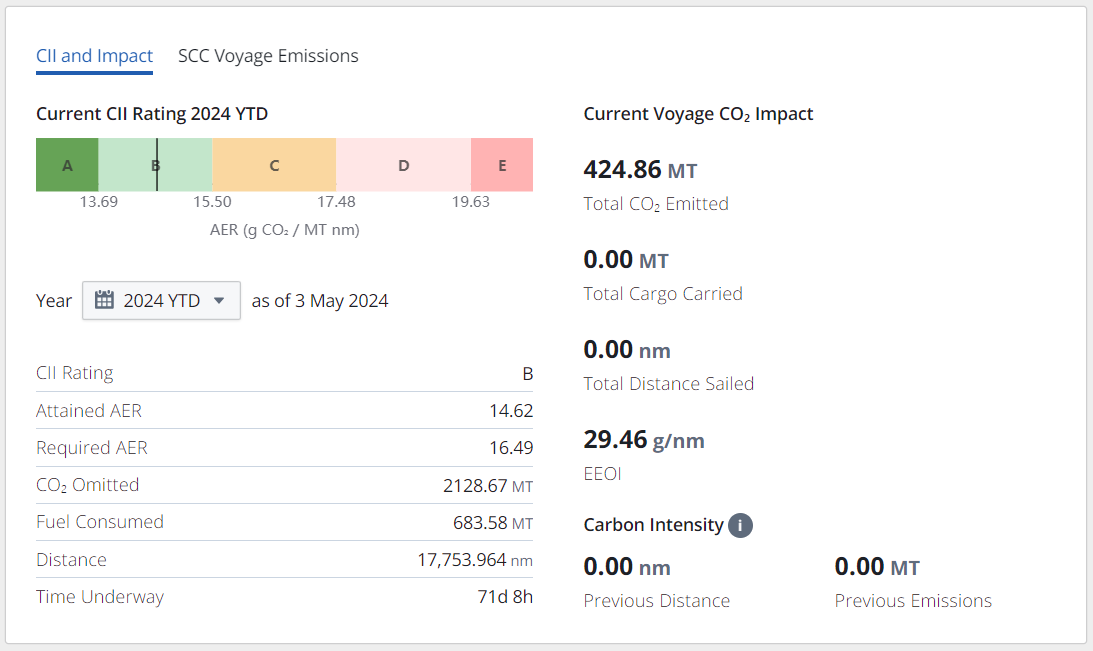
Sustainability card in IMOS X Voyages
The Sustainability section shows the following information:
Calculated Current Year CII rating within the rating band
Current Year AER within the rating band
Overall CII Rating
Attained AER
Required AER
CO2 Omitted
Fuel Consumed
Distance traveled
Time Underway
Current Voyage CO2 Impact section:
Total CO2 Emitted
Total Cargo Carried
Total Distance Sailed
EEOI
Carbon Intensity:
Previous Distance
Previous Emissions
If you are using the IMOS X SCC Emissions workflow, you will see the SCC Voyage Emissions subsection within the Sustainability card showing the emissions report table and data.
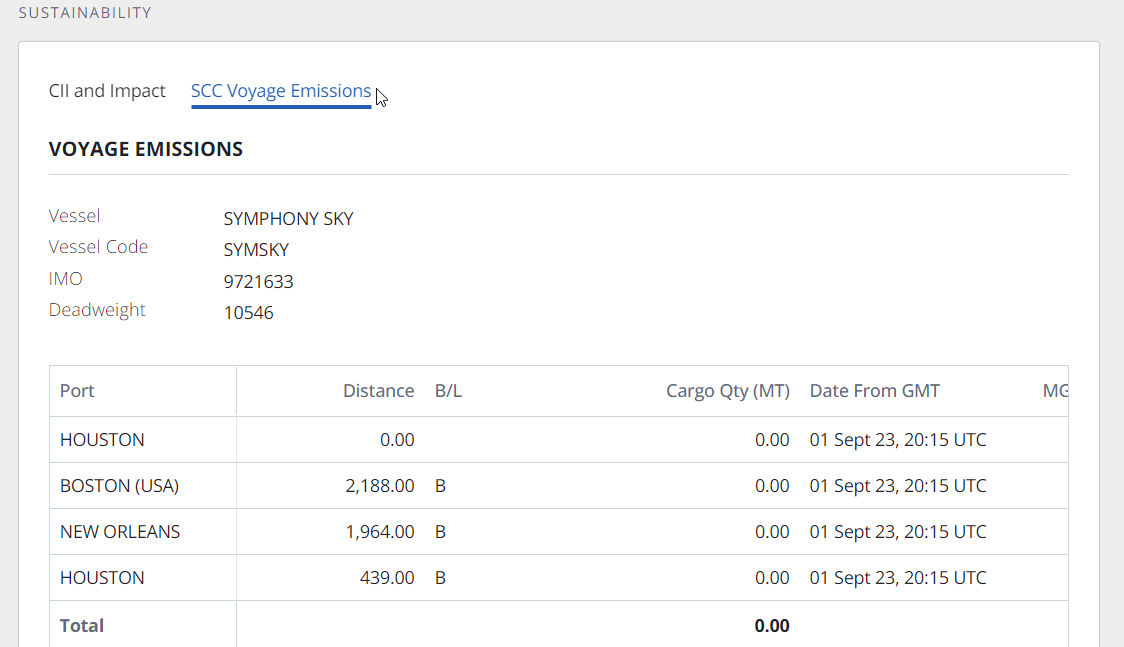
SCC Voyage Emissions table in IMOS X
P&L
In the P&L section, you can access streamlined Profit and Loss information for financial monitoring.
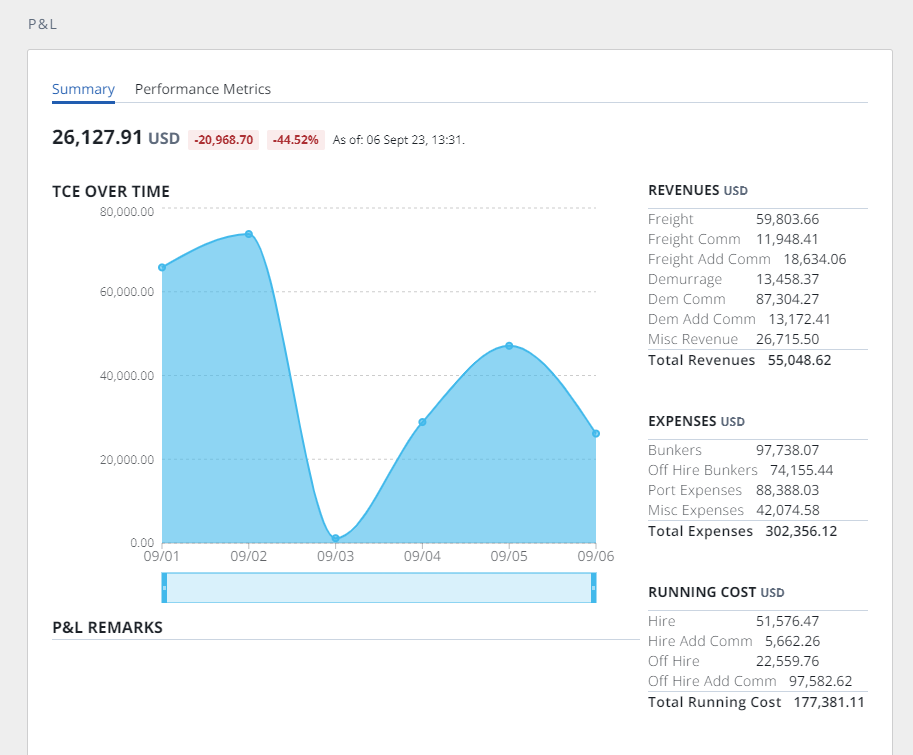
P&L Summary
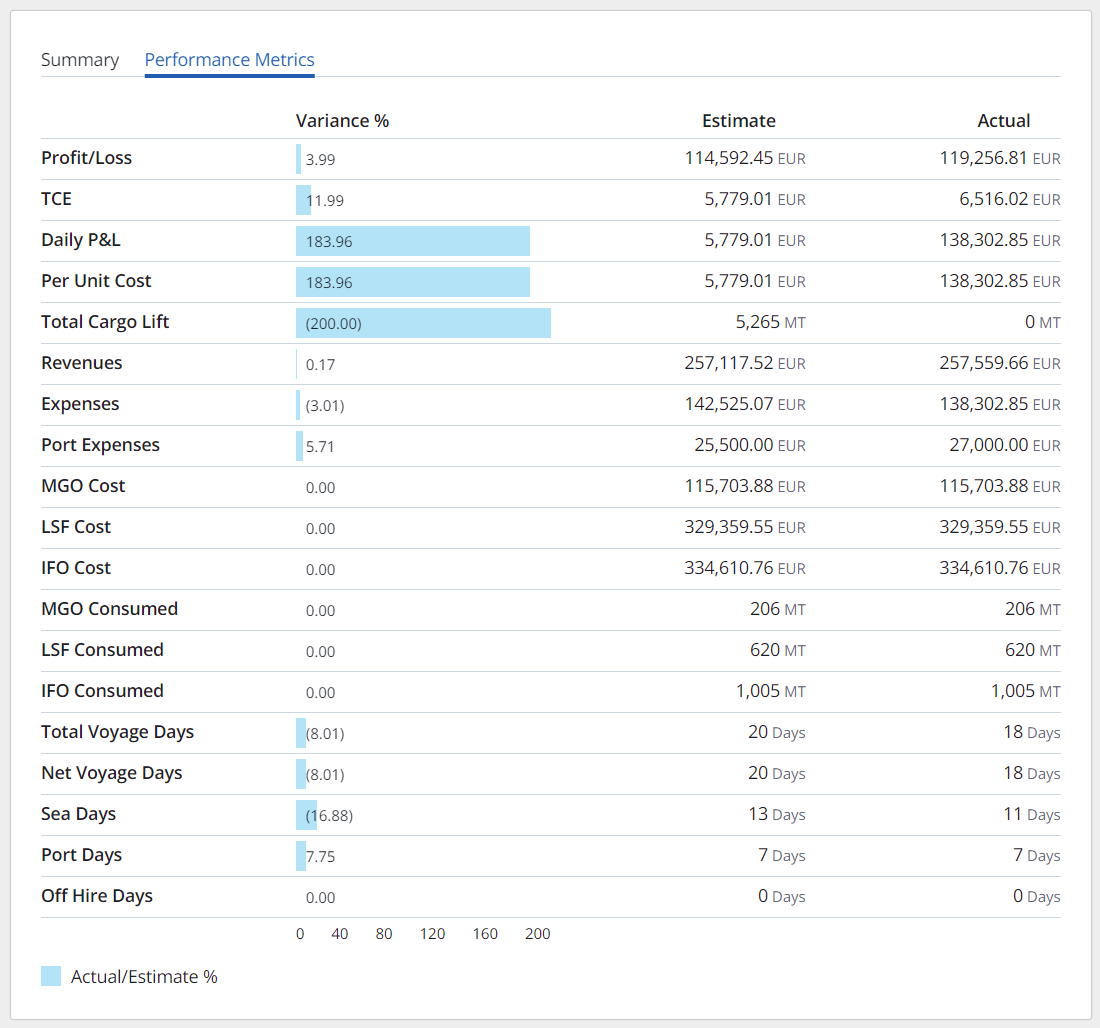
P&L Performance Metrics
The P&L summary shows the following information:
Current TCE Value
A graph plotting the TCE over time
Select a specific timeframe using the date slider.

P&L date slider in IMOS X
P&L Remarks
Revenues: Freight, Demurrage, and Total Revenues
Expenses: Bunkers, Port Expenses, and Total Expenses
Running Costs: Hire, Total Running Costs
Performance Metrics: includes more granular P&L Categories
Profit/Loss, Daily P&L, Per Unit Cost, Total Cargo Lift, Revenues, Expenses, VC In Freight, VC In Demurrage, Fuel Cost (for each fuel type), Fuel Consumption Qty (for each fuel type), Total Voyage Days, Net Voyage Days, Sea Days, Port Days, Off Hire Days
The percentage variance between the estimate and actual amounts for each category with a scale bar showing the percentage variance scale relative to the other categories
Estimated value for each category
Actual value for each category
Forms
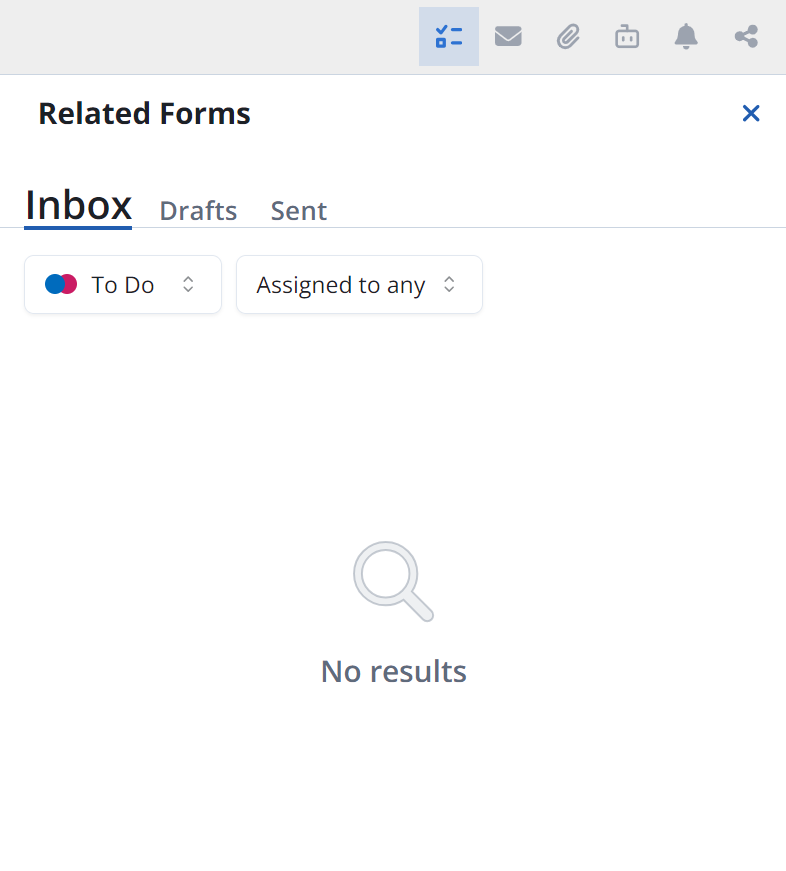
Quickly access forms related to this voyage by selecting the Forms icon in the upper right of the Voyage Details view.
Messages
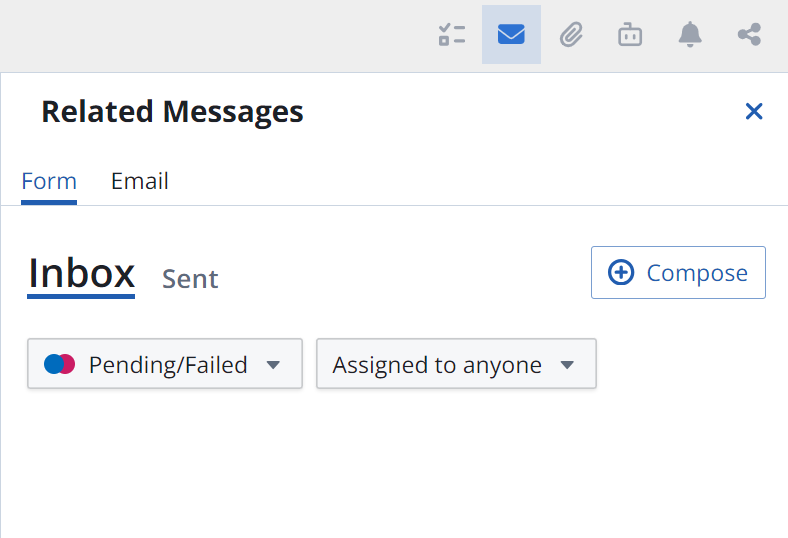
Select the envelope icon to view messages related to this voyage.
Attachments
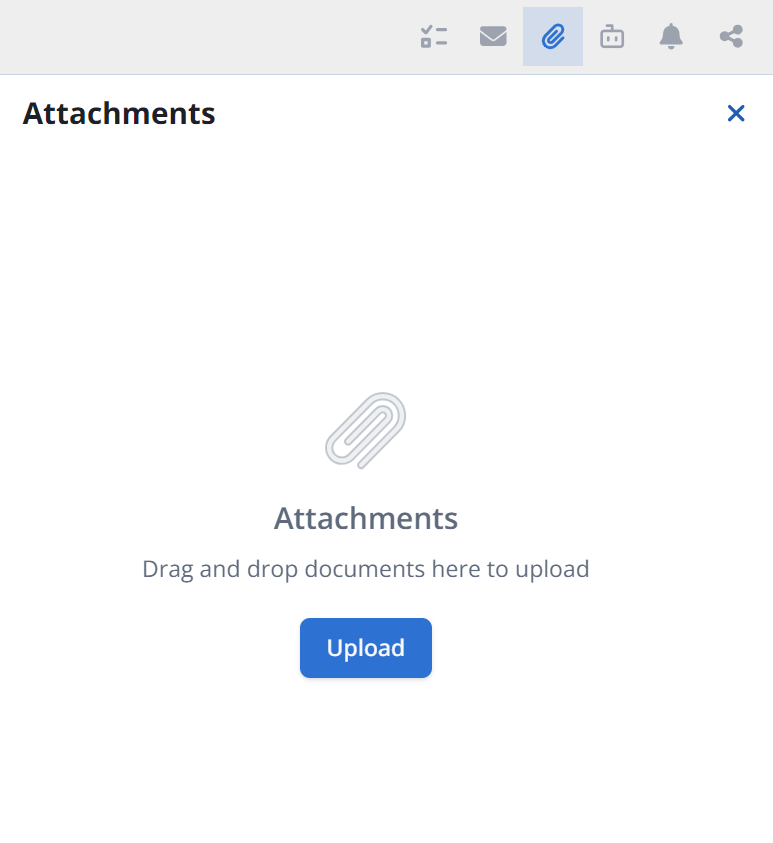
You can open and add/remove attachments for the voyage by selecting the paperclip icon in the upper right of the Voyage Details view.
Tasks & Alerts
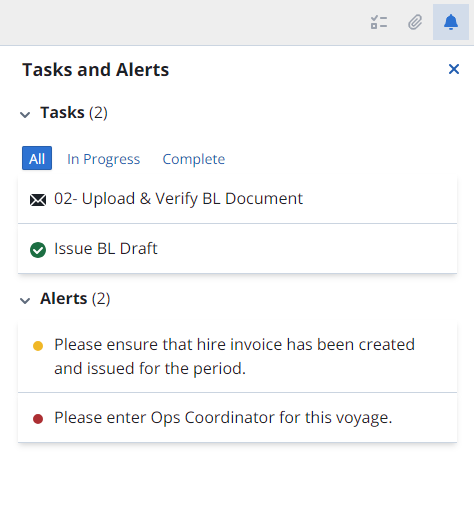
To view Tasks & Alerts for a voyage, select the bell icon.
