AIS Derived Data
Derived data depends on three key areas- polygons, stoppages and journeys. The combination of these three areas make up the core of VV Trade.
Introduction
Regular users of AIS will appreciate the size of the data sets and the challenges associated managing it. To analyze key industry metrics, such as fleet speeds or global cargo miles, immense computing power is needed– something that’s both costly and complicated.
VV Trade provides an accurate and innovative platform to access this kind of information. We’re able to cleanse and manipulate raw AIS data into something that’s valuable and easy to digest, at both a micro and a macro level.
Main Quality Checks
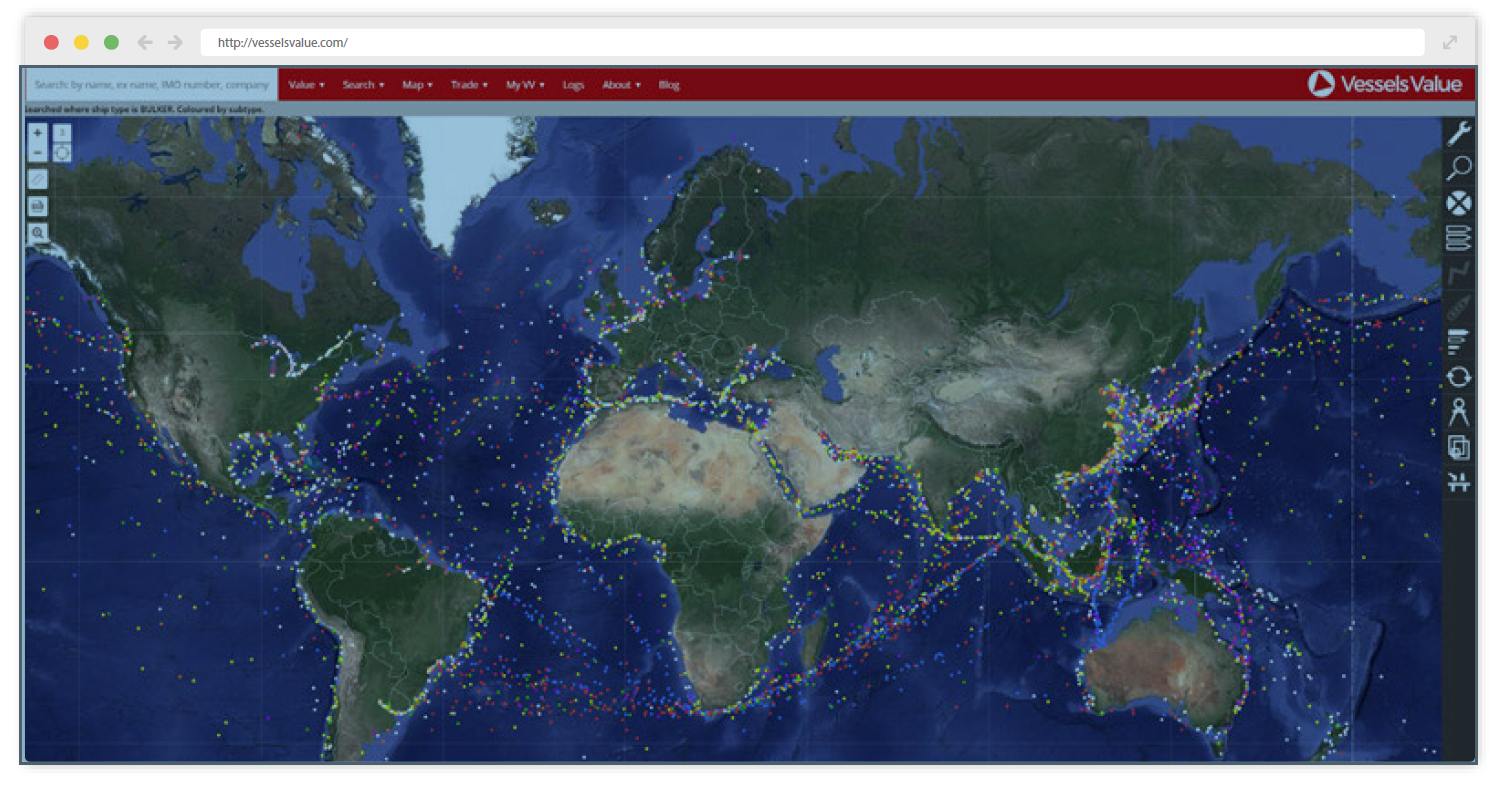
Alongside the raw AIS tracking data, polygons form the geographic foundation of VV Trade. Polygons are shapes used to geofence thousands of locations where vessels move and operate. VV has an extensive global polygon database, ranging from ports, shipyards, offshore terminals, port terminals, ship breaking yards, anchorages and more. Our database currently contains a complete picture of the maritime domain.
Our polygon database is constantly growing and maintained on a daily basis by our research team. We have a whole host of discrepancy checks which monitor the accuracy of our polygons.
New Polygons
We receive daily market intelligence which highlights new port developments and extensions. We follow these updates to ensure our database is up to date. We also look into any “unknown stoppages” that are made to ensure we don’t miss any locations.
Polygon Accuracy
Our Trade polygons are drawn following a strict set of criteria to ensure we are exact in identifying where ships stop. We run discrepancy checks on polygon shapes, names and locations, to flag existing polygons which might need refining. Each polygon is cross checked by the VV research team to ensure the commercial and operational details of the facility are correct.

Example of the VesselsValue Mapping product
Stoppages
AIS and polygon data is combined with our complex algorithms to identify stoppages, forming the micro data which feeds into the bigger picture of vessel trading routes and cargo movement.
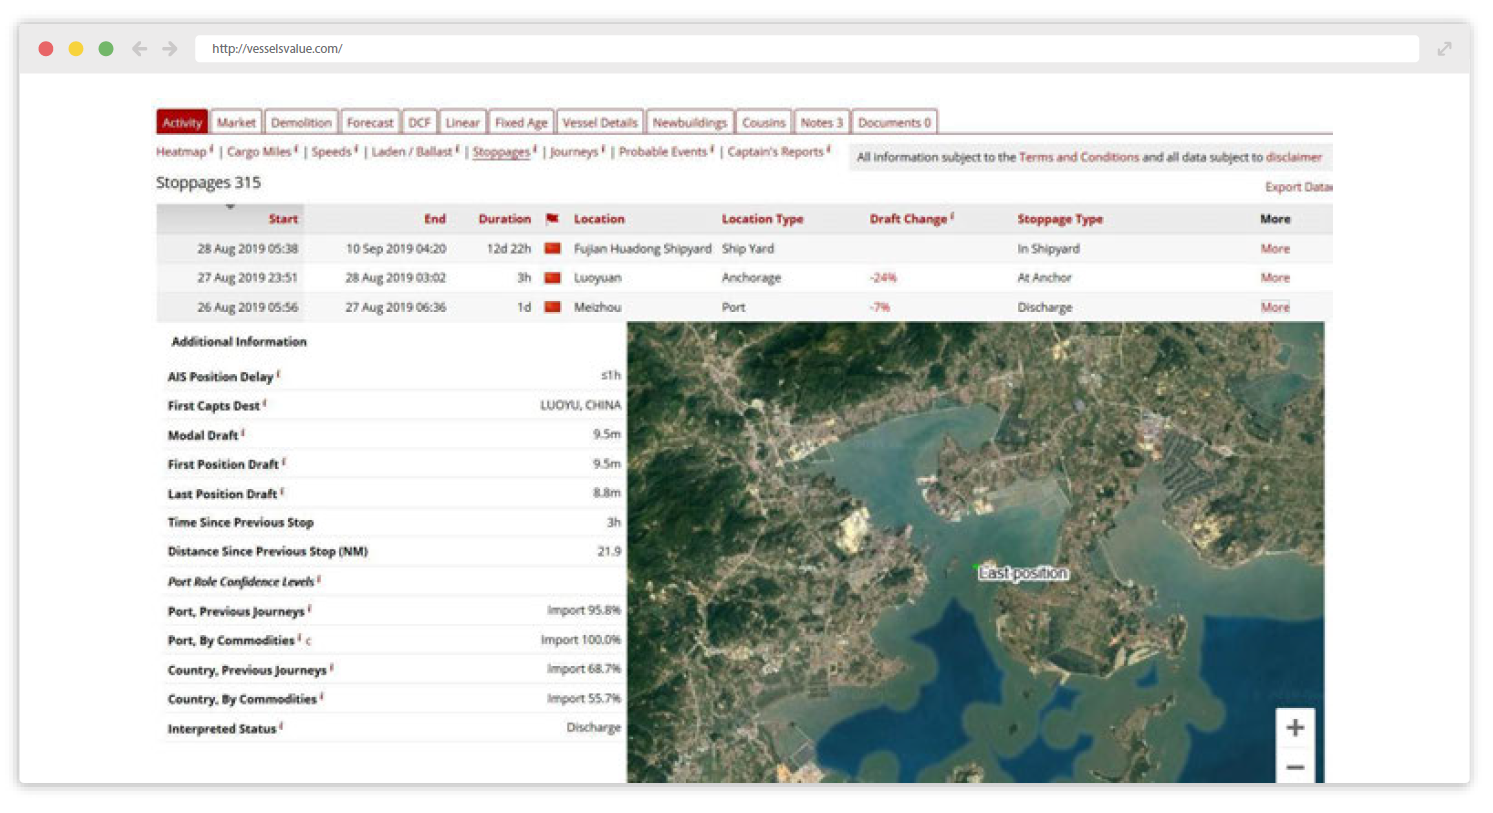
We identify stoppages happening in ports, anchorages and shipyards, and at terminal level. Stoppages are assigned a status, whether it’s loading, discharging, awaiting transit, in a shipyard, at anchor or waiting to load. These are derived from a series of indicators including draft changes, expected trading behavior, reported market fixtures, and other terminal level details.
Stoppages are periods where a vessel travels at a speed below a designated threshold captured in a polygon. These allow us to tell exactly when and where a vessel has stopped, and what it’s doing. All this information, including stoppage times, dates, locations and durations are available to subscribers. A useful mini map is included, which shows all positions included within the stoppage.
Total fleet behavior can be seen at a glance in a heat map, and can be further investigated by looking into the type of stoppage (loading, discharging, etc.)

Example of VesselsValue’s stoppage view on a vessel page
Journeys
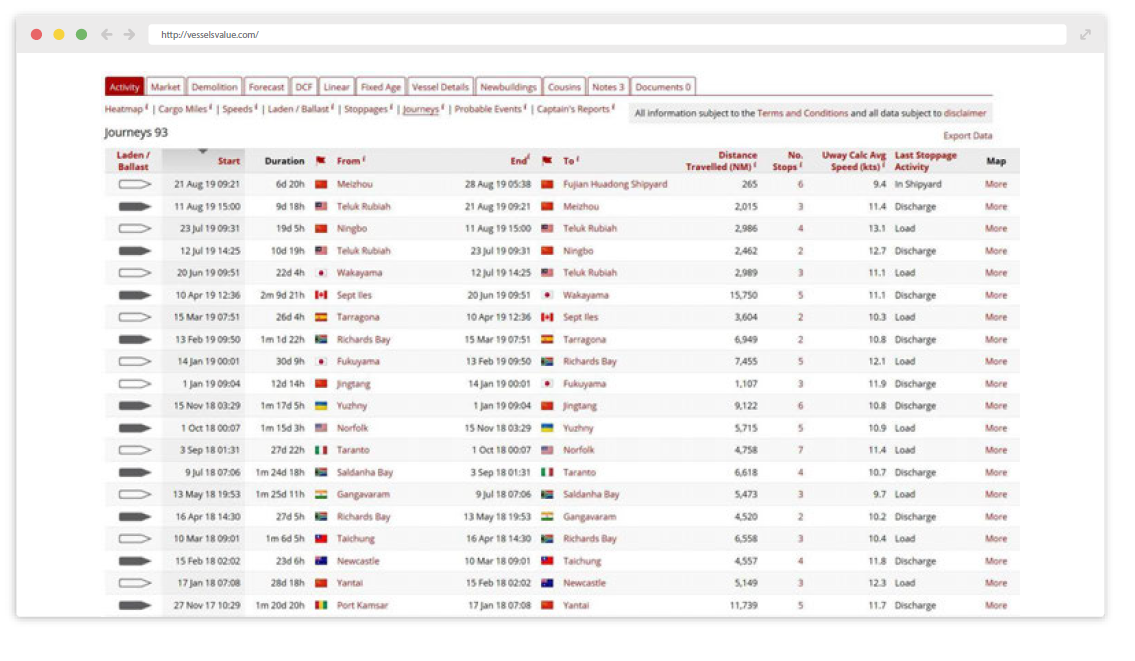
Journeys are created by grouping our stoppages together; 300 stoppages typically relate to around 100 journeys. A journey is marked by a load or a discharge stoppage and can include numerous other stoppages in between.
Journeys are designed to fully capture a ship’s commercial activity and provide valuable information about a ship’s trading habits. Within these journeys we calculate useful metrics such as cargo carried, cargo miles, underway speed, laden status, distances travelled and more. You can even drill down to see which stoppages fit within which journey, providing an invaluable picture into a ship’s behavior.
Routine discrepancy checks focus on journeys with unrealistic speeds or distances and we are constantly reviewing our stoppages and journeys to ensure our logic is representative of true vessel activities. We monitor the performance of our Trade systems, including the speed of the calculations, making sure that it’s at an optimum for the user.
VV Trade distils a ship’s entire history of AIS positions into accurate and useful information that would otherwise take a prohibitive amount of time to process manually. Trade removes the hard work and provides a convenient and user friendly tool, giving a real world insight into vessel activity.

Example of VesselsValue’s journeys view on a vessel page
