To view a Microsoft Excel report that compares Pooling information from two different years:
-
On the Operations menu …, under Pooling, click Pooling Year Comparison.

-
Enter two years to compare: Year 1 and Year 2.
-
Click OK. The report consists of two parts:
-
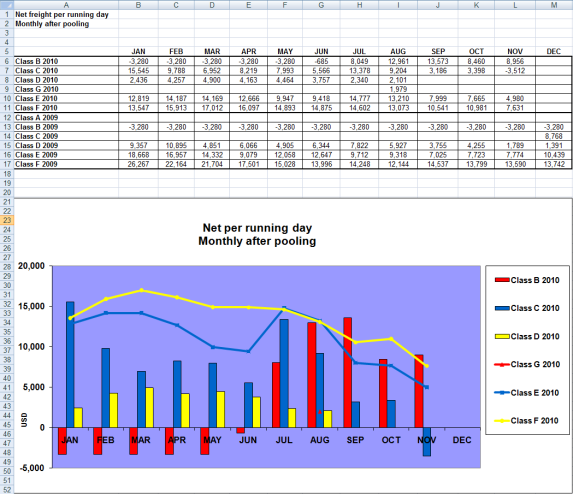
Net per running day, Monthly after pooling:
-
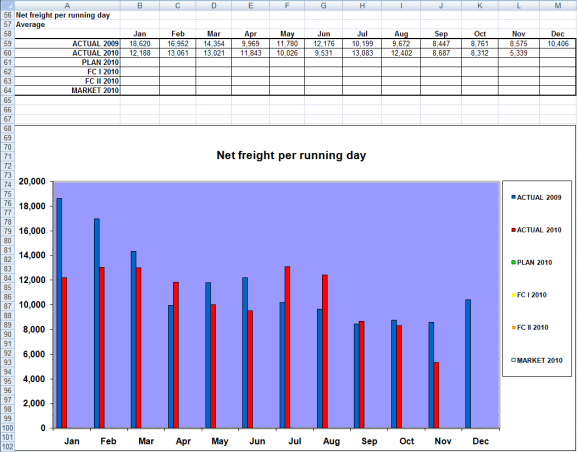
Net freight per running day, Average:
-
If you entered a Net Daily Plan value on the Pool Assignment form, that estimate also appears here.
-
You can also enter Market values for comparison; the chart updates to include any values you enter or edit.
-
-