
Note: You must have the View Reports General Permission enabled.
The Reports tab includes up-to-the minute data reported by your fleet, to help you in making your business decisions. It gives you multiple options for visualizing data and the ability to analyze multiple dimensions, like distance, speed, weather, and fuel consumption. To view Microsoft Power BI reports here, based on Veslink form data, import them on the System Configuration page.
You can do any of the following:
-
In the IMOS Report Designer, create reports with Source Veslink Forms.
-
On the System Configuration page, import custom reports from the IMOS Report Designer.
Performance Dashboard
When you click the Reports tab, the Performance Dashboard appears.
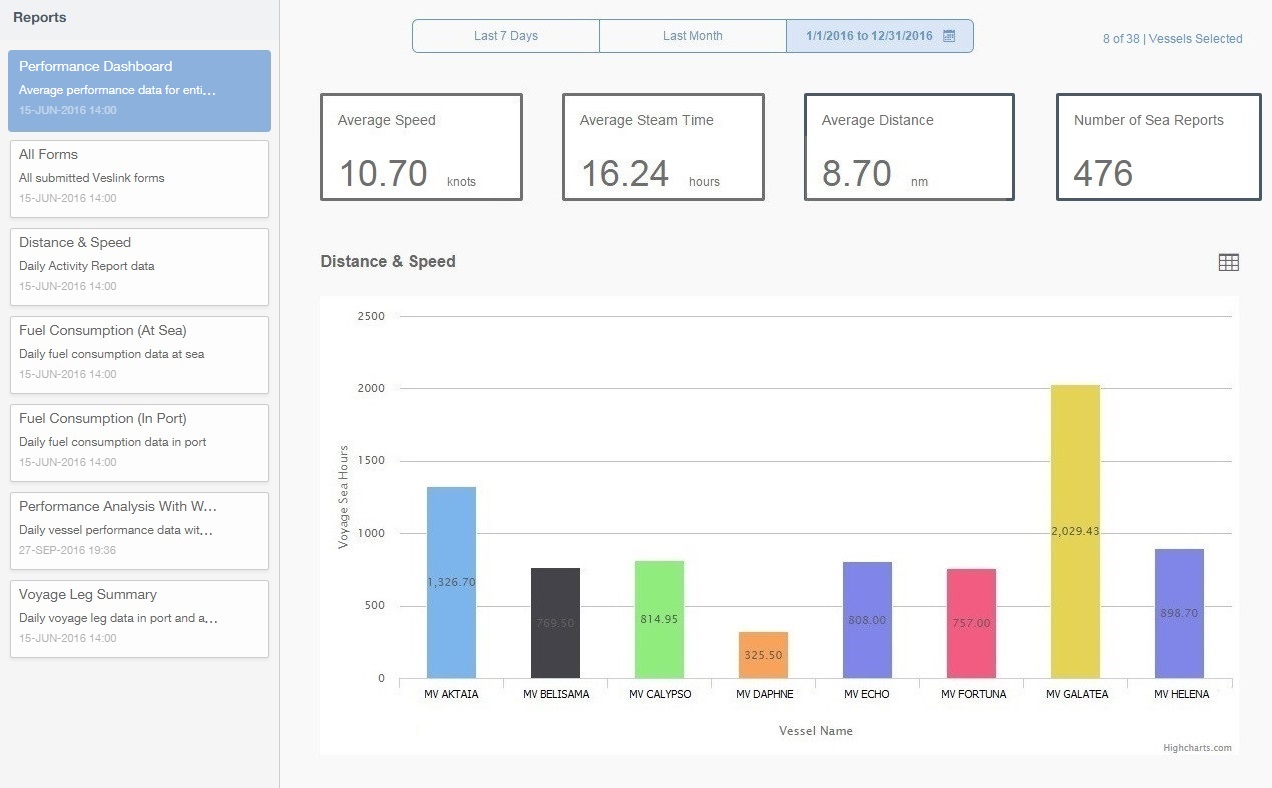
All your reports appear on the left, including a report description and last modified date.
-
To select a date range, click buttons at the top of the page:

-
Last 7 Days
-
Last Month
-
Custom Range: Enter a From Date and a To Date and then click Apply.
-
To see all on or before a certain date, leave the From Date blank.
-
To see all on or after a certain date, leave the To Date blank.
-
-
-
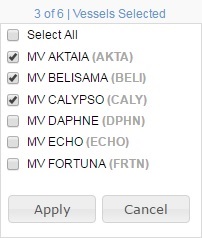
To select the vessels, click Vessels Selected at the top of the page.
-
To view forms of Report Type Other with Applicable type Other (Non-Voyage), click All Forms.
Running a Report
To run a report in Veslink, click its card in the Reports pane:
-
-
All Forms
-
Distance and Speed
-
Fuel Consumption (At Sea)
-
Fuel Consumption (In Port)
-
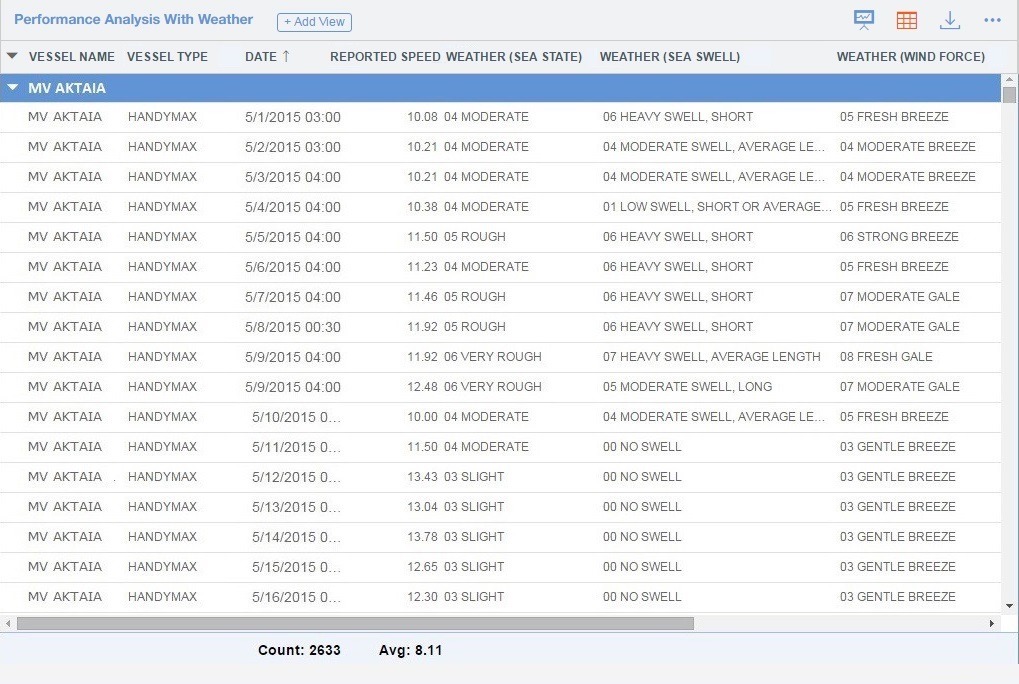
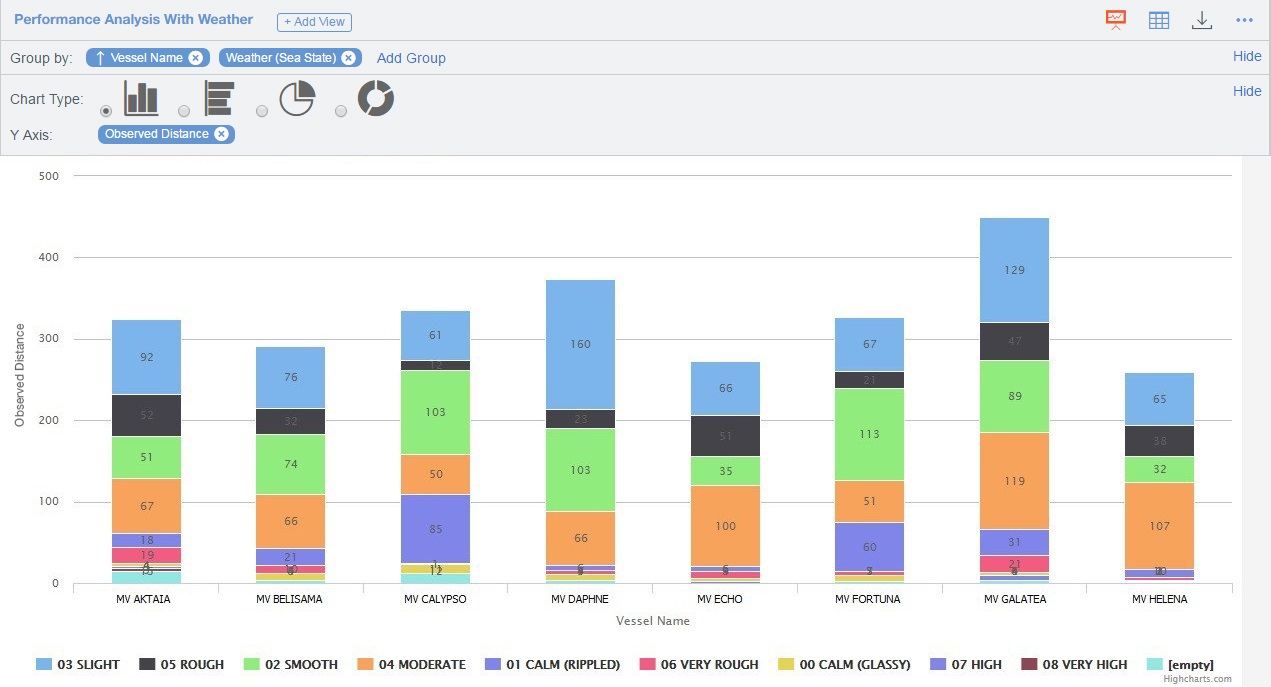
Performance Analysis With Weather
-
Voyage Leg Summary
-
Any custom report
-
Editing a Report
To edit a report, you can change your view, filter, group, sort, and search for data, and create user views.
With permission, you can also edit Power BI reports based on Veslink form data.
Changing Your View
Reports appear in Grid view 
To use Chart view, click 
Note: Chart view is not available for the All Forms report.
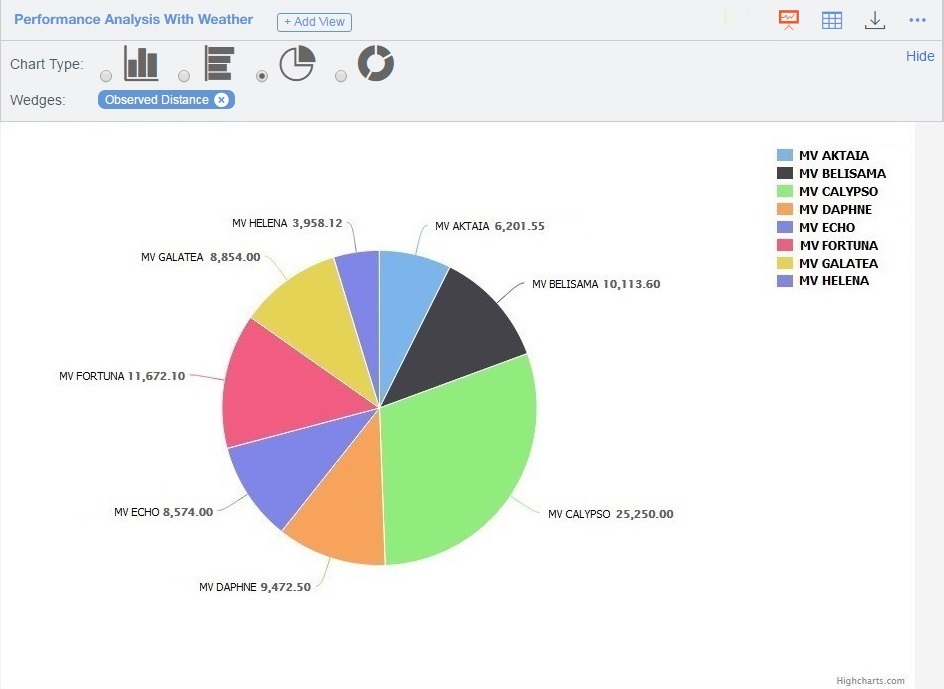
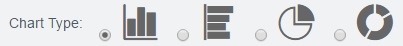
To select the Chart Type:
-
Click on the three dots and then click Chart Settings on the Options menu. A Chart Settings line appears above the chart.
-
Select the Chart Type and its options:
-
For a bar chart, select the y axis.
-
For a pie chart, select the wedges.
-
To hide the Chart Settings line, click Hide in the line.
-
Filtering
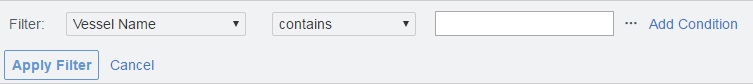
To filter data:
-
Click on the three dots and then select Filters on the Options menu. A Filter line appears above the report.
-
Click Add Filter and then select values.
-
To add a condition to a filter, click Add Condition.
-
To remove a condition, click Remove.
-
-
Click Apply Filter.
-
To remove a filter, click the X next to its name.
-
To hide the Filter line, click Hide in the line or click Filters on the Options menu again.
-
Grouping
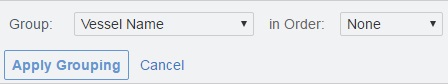
To group data:
-
Click on the three dots and then click Group by on the Options menu. A Group by line appears above the report.
-
Click Add Group.
-
To add a grouping, select a field to group by and the Order, and then click Apply Grouping.
Click for an example with more than one grouping.
-
To remove a grouping, click the X next to its name.
-
To hide the Group by line, click Hide in the line or click Group by on the Options menu again.
-
Sorting
To sort data:
-
To sort by a column, click the column heading. Data is sorted in descending order.
-
To change the sort order, click the column heading again.
-
To remove a sort:
-
Click on the three dots and then click Sort by on the Options menu. A Sort by line appears above the report.

-
Click the X next to its name.
-
-
-
To hide the Sort line, click Hide in the line or click Sort by on the Options menu again.
Searching
To search for data:
-
Click on the three dots and then click Search on the Options menu. A Search line appears above the report.

-
Type a search term and press Enter. Matching data appears.
-
To clear the search term, click the X at the end of the Search line.
-
To hide the Search line, click on the three dots and then click Search on the Options menu again.
-
-
Creating a User View
You can create your own view of a report and save it to use again.
-
To create a new view, click

Note: After one view has been created, you must first select which view you want to copy: the default view or a user view.-
To select the view to copy, click it:
-
For the default view, click the report name.
-
For a user view, click its tab; the selected view tab appears green.
-
-
To copy the selected view, click

-
-
Enter a name for the new view.
-
Modify the view, using options and settings.
-
To rename a view, hover over its tab, click on the three dots, click Rename, and then type the new name.
-
To remove a view, hover over its tab → click on the three dots → click Remove.
-
To reset a view to the default view, click its tab → click on the three dots → click Reset View.
Editing a Power BI Report
Note: You must have the Edit Power BI Reports General Permission enabled.
To edit a Power BI report, based on Veslink form data, run it and then click 
To learn how to use Power BI, see complete Power BI Documentation. Key topics include the following:
|
Topic |
Links |
|---|---|
|
Getting Started |
|
|
Creating a Report |
|
|
Editing a Report |
|
|
Sharing a Report |
Exporting a Report
You can export the Grid view of a report in several formats. Click 
-
CSV
-
Excel
-
PDF
-
Word
-
XML
Related Article: https://vesonjira.atlassian.net/wiki/spaces/veslink