
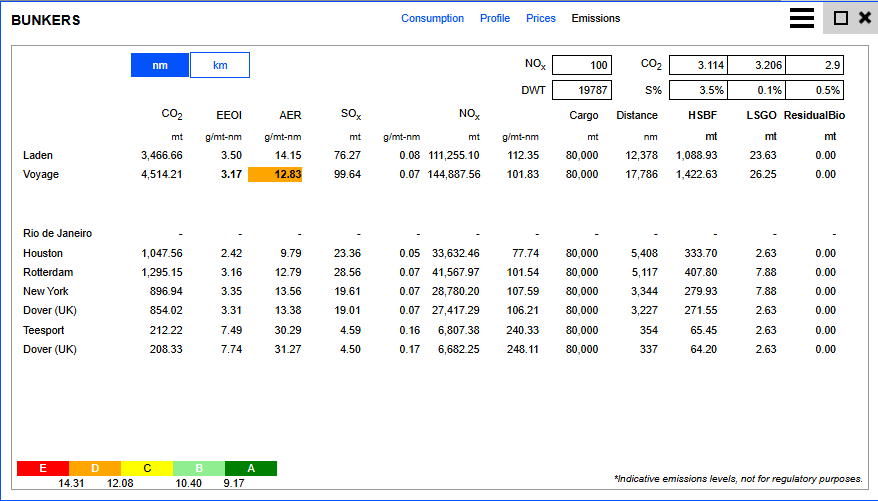
The Emission Feature is found in Estimates and Voyages. It guides you on how your vessel performs during the current voyage. It calculates EEOI, AER, Cii Banding, SOx, and NOx, which are important indicators for shipowners and charterers.
Indicators
The following are the calculations for each of the Indicators:
EEOI
(CO2 x 10^6)/ (Laden Distance x Cargo Loaded)
AER
(CO2 x 10^6)/ (Sailed Distance x Vessel Deadweight)
Cii Banding
Depending on the AER calculated and with reference to the Cii banding chart, the vessel is given a banding from A to E. The Banding given is marked by the color under the "AER/ Voyage“ column/ Row.
Cii banding calculation depends on the type of vessel. Therefore, please ensure that the correct selection is made in Vessel Register> Emission.
SOx
(Total Bunker Consumption x Sulphur) x 2
NOx
(Total Bunker Consumption x NOx)/ 1000
Emission Content
The emission's content requires manual input once in Estimate/ Voyages for it to carry forward to subsequent newly created Estimate/Voyages.

EU ETS
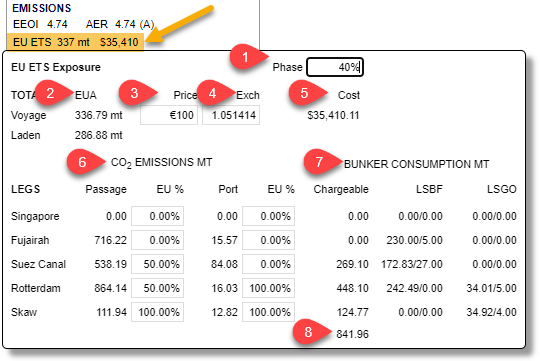
Left-click the yellow highlighted text shown in the following image to open up the EU ETS detailed view.
-
Phase: The EU ETS regulation applies in phases: 40% for 2024, 70% for 2025, and 100% from 2026 onwards. VMS detects the Phase in percent from the itinerary date (year). From January 1st 2026 onward, EU ETS includes CH4 and N2O in addition to CO2. .
-
EUA: CO2 Allowance that is applicable for the ETS regulation
-
Price: Price in EUR per mt CO2. This value can be defaulted via setting on the back end. Please reach out to our Support Team for such a request.
-
Exch: The exchange rate is set in Company Setting> Currency Exchange Rates. This converts the Emission cost into USD in pointer 5.
-
Cost: EUA Cost in USD (EUA x Price x Exch)
EUA x Price x Exch
-
CO2 Emission: This shows a breakdown of CO2 Passage/ Port emission per leg and determines EU% as per the regulation (either 0%, 50%, or 100% depending on the rotation of the EU port call)
-
Bunker Consumption: This shows a breakdown of CO2 applicable for EU ETS that corresponds to its Bunker Consumed in each leg’s Passage/ Port
-
Total chargeable emission (This amount is multiplied by Phase in % to provide value in pointer 3.2 EUA)
More information on further development of this feature can be found in the EU ETS article.
FuelEU and Fuel EU Bio Fuel Breakeven Analysis
The following articles cover the above.