The Voyage Enhanced view is the Veson Platform's native view of your IMOS voyages. Toggle it on to see the same voyage you maintain in IMOS — itinerary, cargoes, bunkers, claims, sustainability, and P&L — in a modern, read-oriented layout with maps, trend charts, and CoCaptain context. Your IMOS voyages are mirrored into the platform and kept in sync automatically.
Toggle the Enhanced view
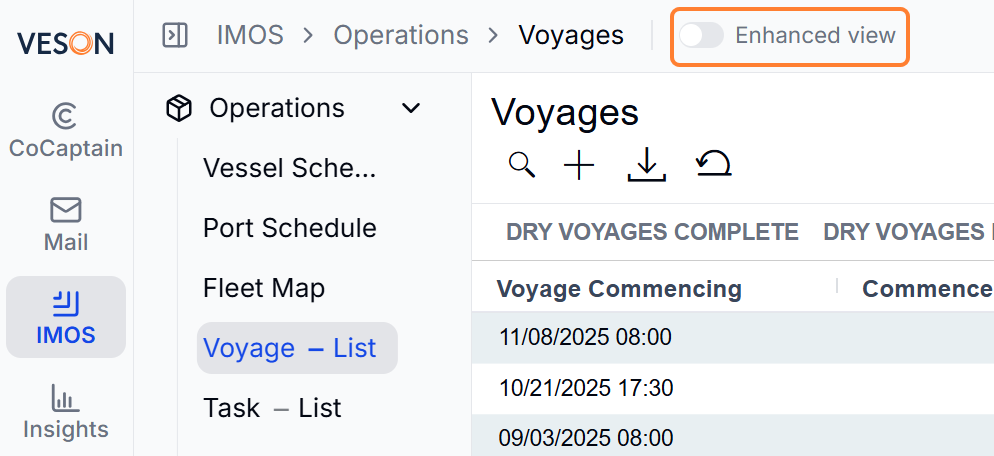
In the Voyages workspace, use the Enhanced view toggle in the header to switch between the classic IMOS view and the Enhanced view. Your choice is remembered per workspace for the rest of your session. The Enhanced view is read-oriented: you review and analyze the voyage here, while edits are made through Forms or in the classic IMOS view. The toggle is not shown on voyages that were shared to you by a counterparty.
Voyage List
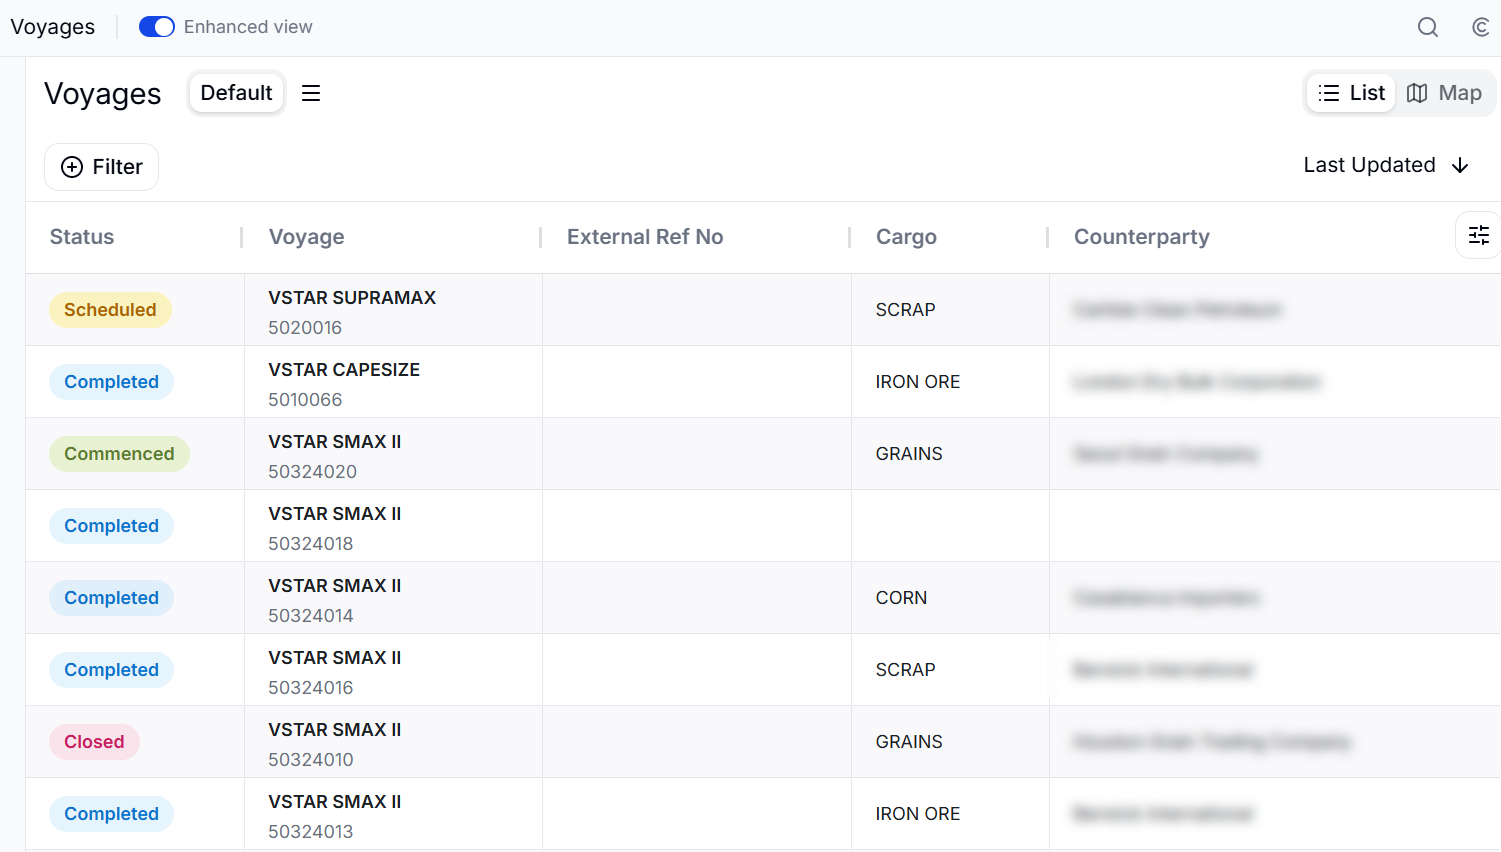
The Voyages list shows your voyages with these columns: Status, Voyage (vessel and voyage number), External Ref No, Cargo, Counterparty, Load, Progress, Discharge, Last Updated, Voyage Operator, FD Manager, Type, CP Date, BL Date, and Sharing. Filter by Status and Type, choose your own columns, and switch between List and Map views.
Voyage Detail
The detail page is organized into the following sections.
Overview
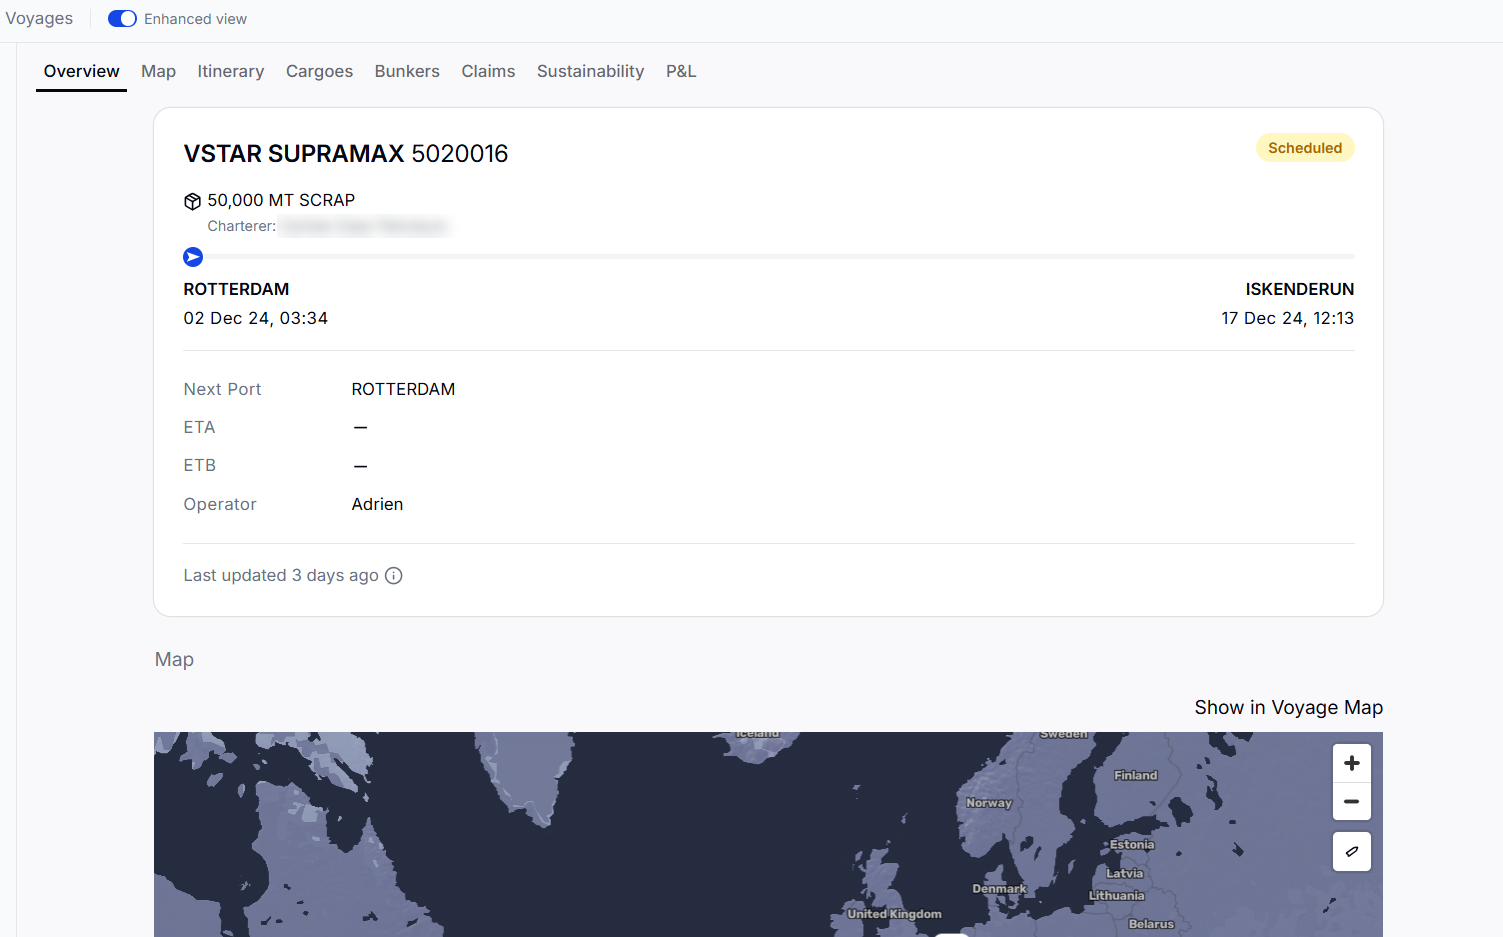
A summary header with the vessel, voyage number, and status; the cargoes on the voyage with their counterparties (Owner or Charterer); an itinerary progress bar; and key fields including Operator and Next Port ETA/ETB.
Map
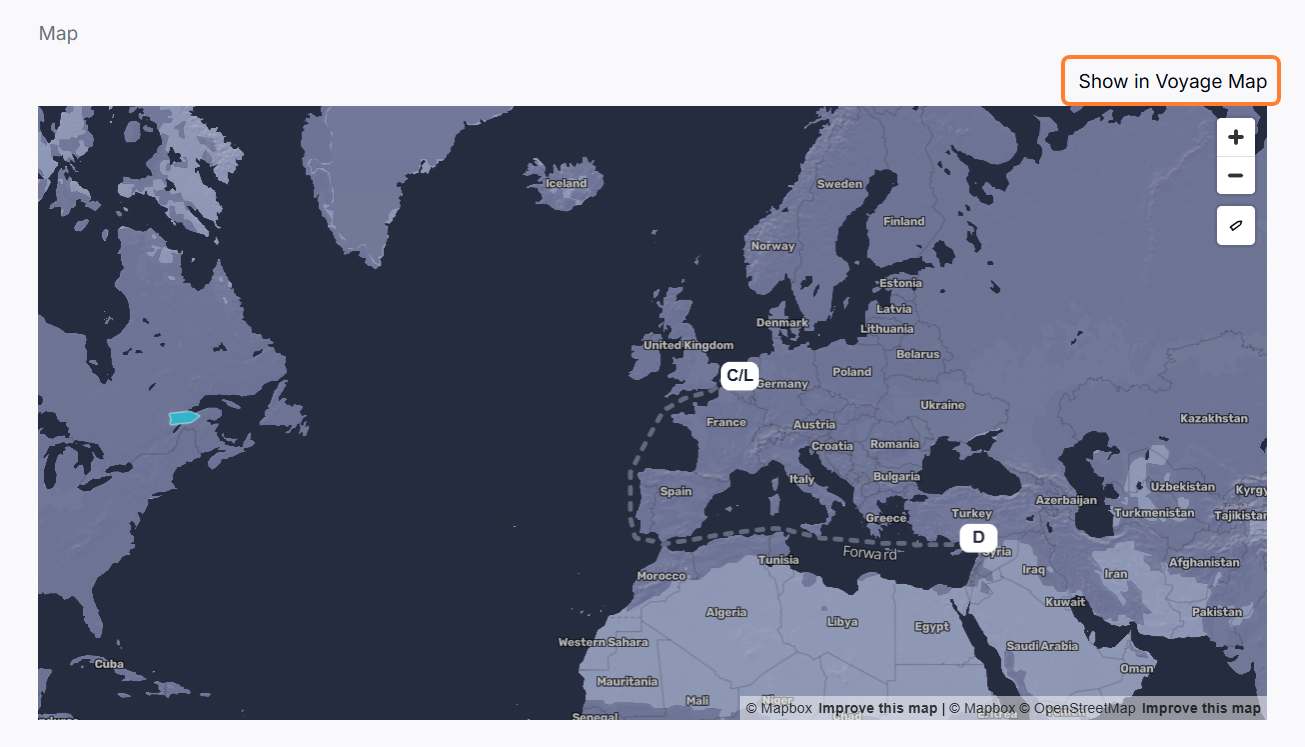
A map of the voyage showing the vessel's current position, route, and port markers. A Show in Voyage Map link appears for active (Scheduled or Commenced) voyages.
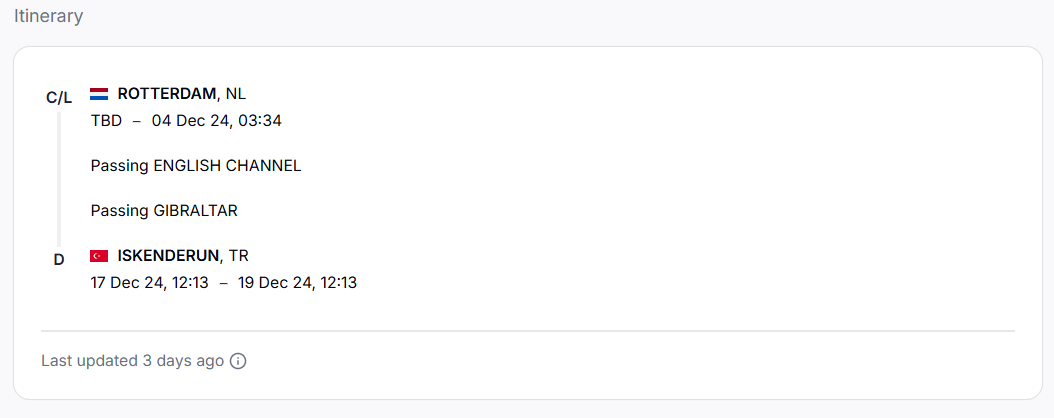
Itinerary
A timeline of the voyage's ports with arrival and departure times, port functions, at-sea legs, and — where available — berth-level detail from Oceanbolt.
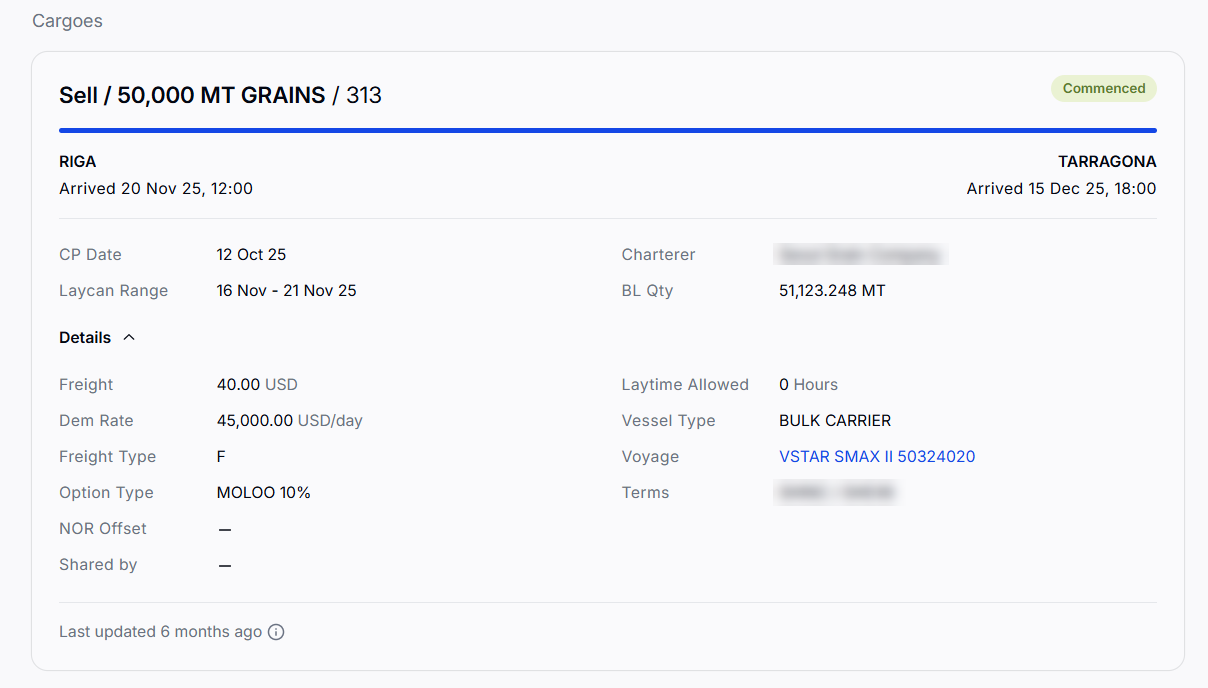
Cargoes
The cargoes on the voyage, each as a card you can select to open cargo details in the side panel.
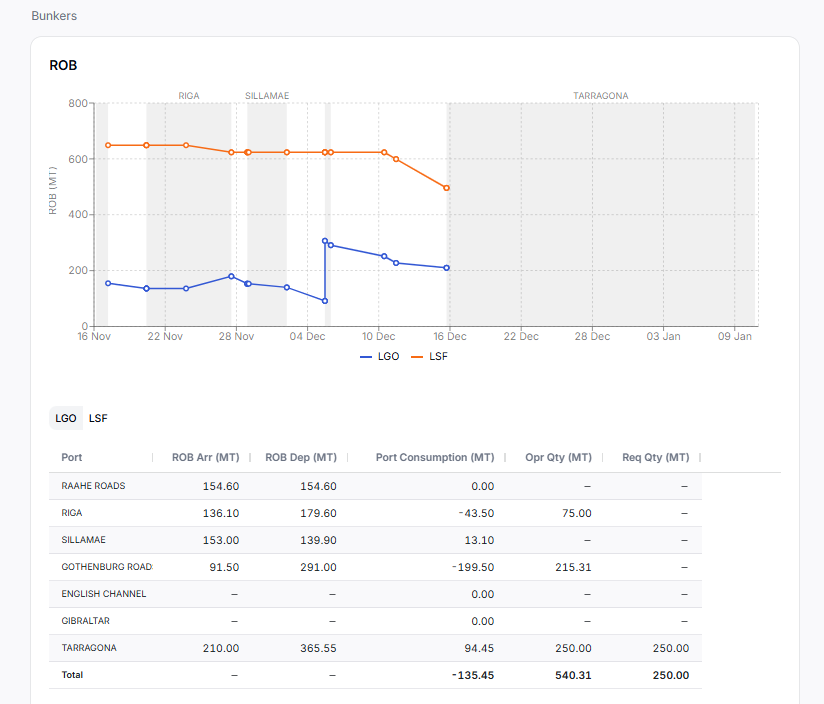
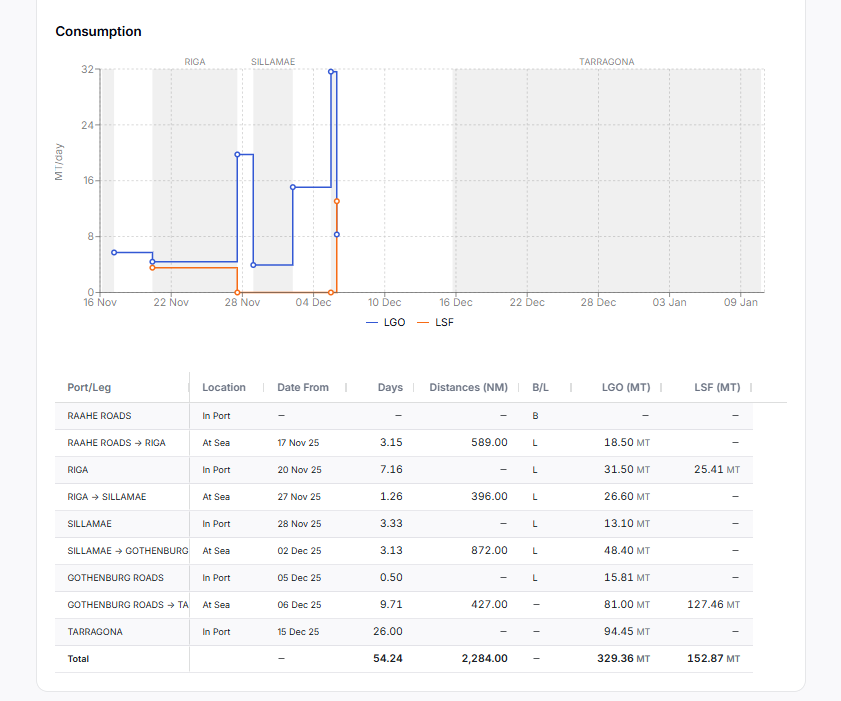
Bunkers
Two views of fuel: ROB (remaining on board by fuel type, as a chart and a table of arrival/departure ROB and port consumption) and Consumption (consumption by leg and port, with distances and per-fuel columns).
Claims
A summary of Payables, Receivables, and Net Balance, with cards for payable and receivable claims and any claims still pending AP/AR classification. CoCaptain's suggested claims for the voyage appear here. (Hidden on voyages shared to you.)
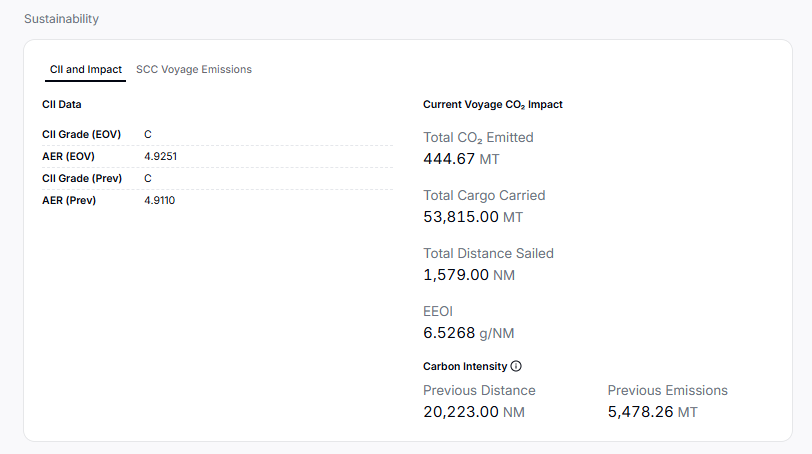
Sustainability
Two tabs: CII and Impact (CII grade, AER, and CO2/EEOI impact at voyage commencement) and SCC Voyage Emissions (per-port distance, cargo, and sea/port consumption by fuel).
P&L Variance
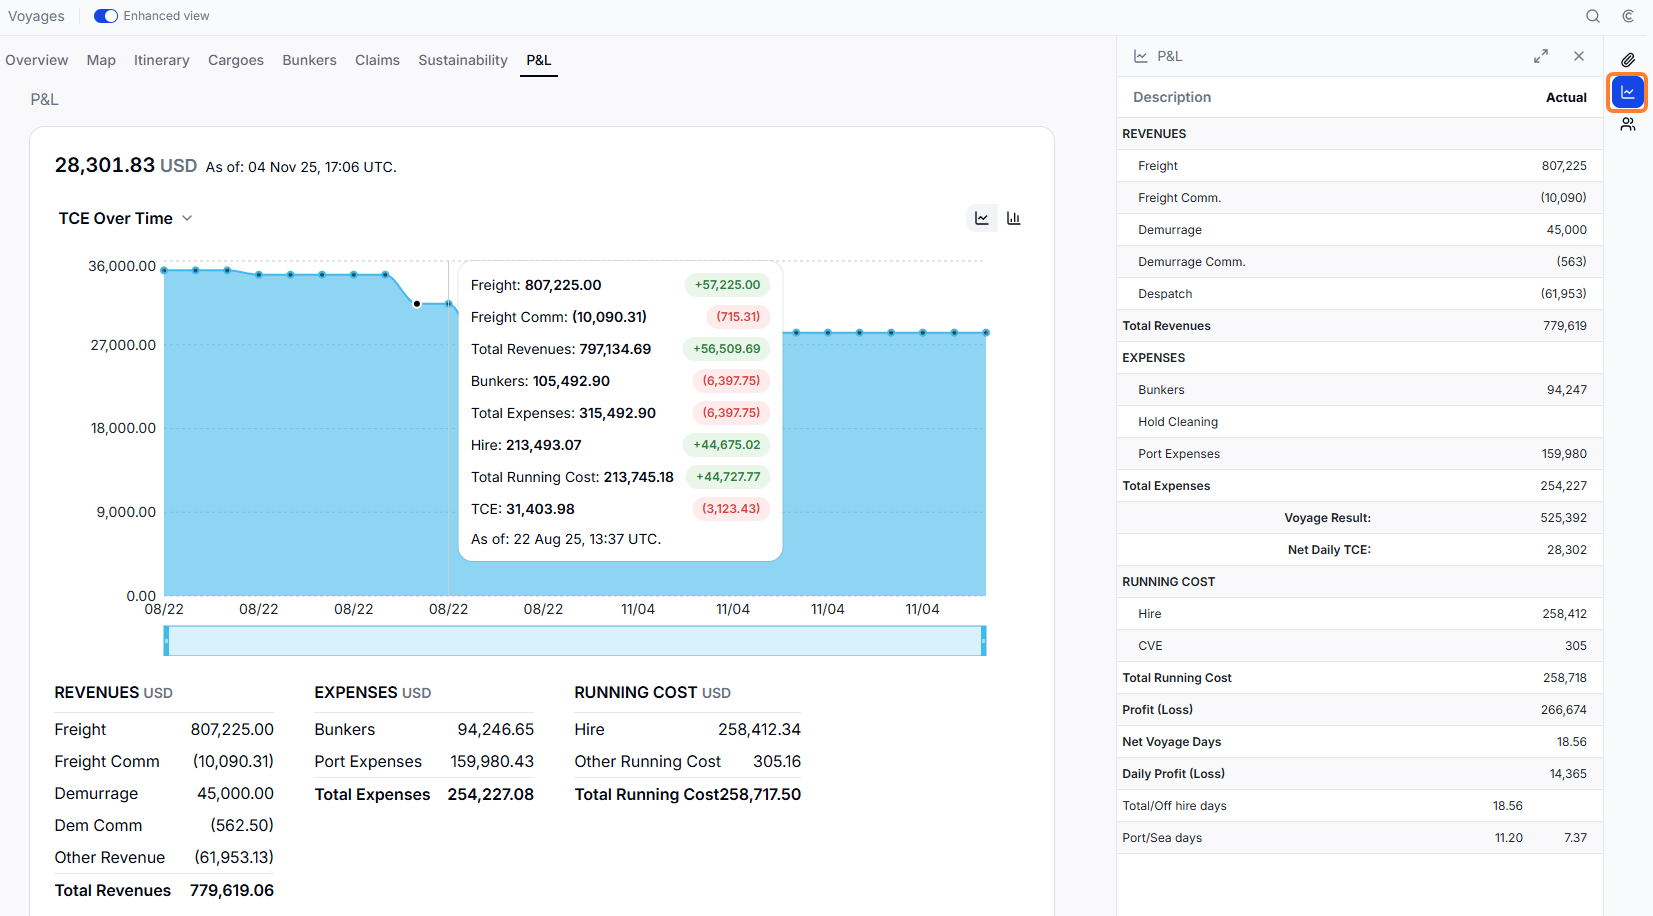
The voyage P&L is available from the P&L side panel (chart icon) and, in expanded mode, includes a full estimate-versus-actual comparison and an AI variance analysis.
P&L table
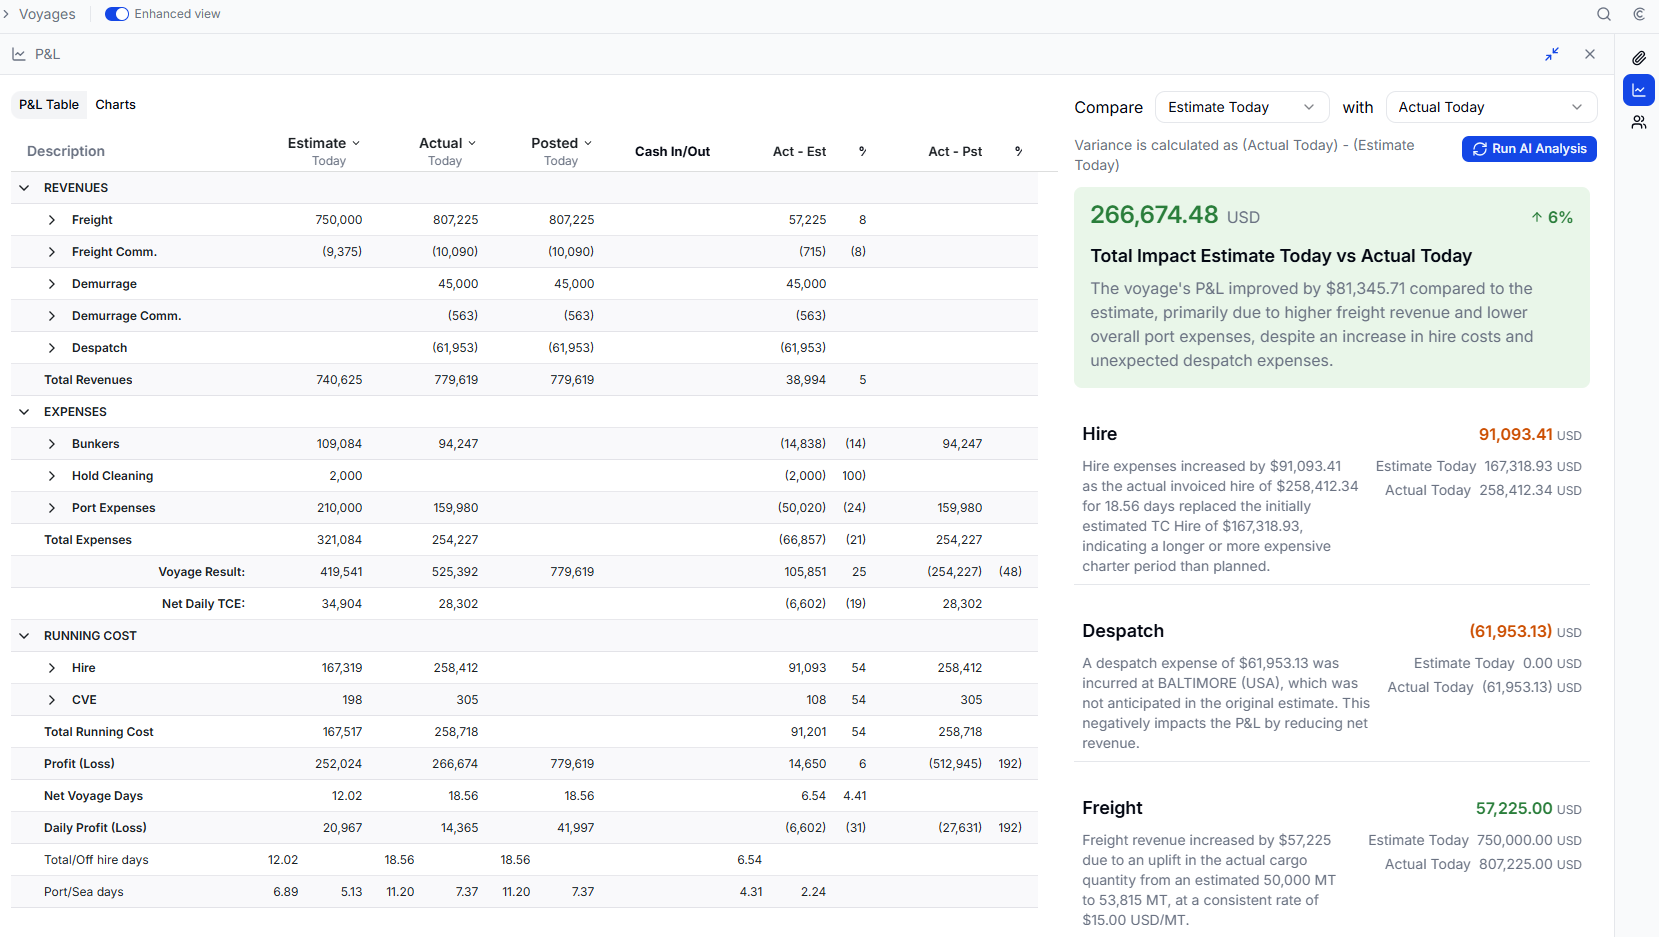
Collapsed, the panel shows Description and Actual. Expanded, it shows three comparison columns — Estimate, Actual, and Posted — plus a Cash In/Out column and two variance pairs (Act − Est and Act − Posted), each with a %. Select a column header to re-point it at a saved snapshot (for example Today, Initial, Daily, Accrual, or Closed) or a Deviation Estimate. Rows are grouped into Revenues, Expenses, Running Cost, Linked Trades Cost, Lease Cost, and Market Running Cost, with summary lines for Voyage Result, Net Daily TCE, Profit (Loss), Net Voyage Days, and Daily Profit (Loss).
Variance Breakdown
The Variance Breakdown sits beside the expanded P&L table and explains what moved between two versions of the P&L. Use the Compare and with selectors to choose any two of your P&L columns; by default this compares the original Estimate with the current Actual. It highlights the top categories by size of variance and shows a Total Impact summary — the overall profit/loss change with its percentage — colored green when favorable and amber when unfavorable. CoCaptain generates a short narrative explaining the overall change and each category; use Run AI Analysis to regenerate it.
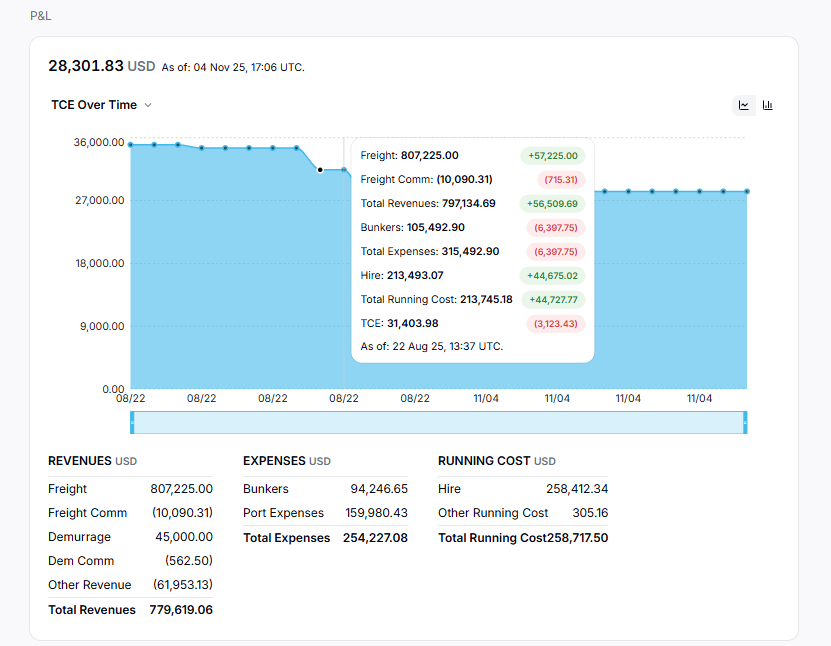
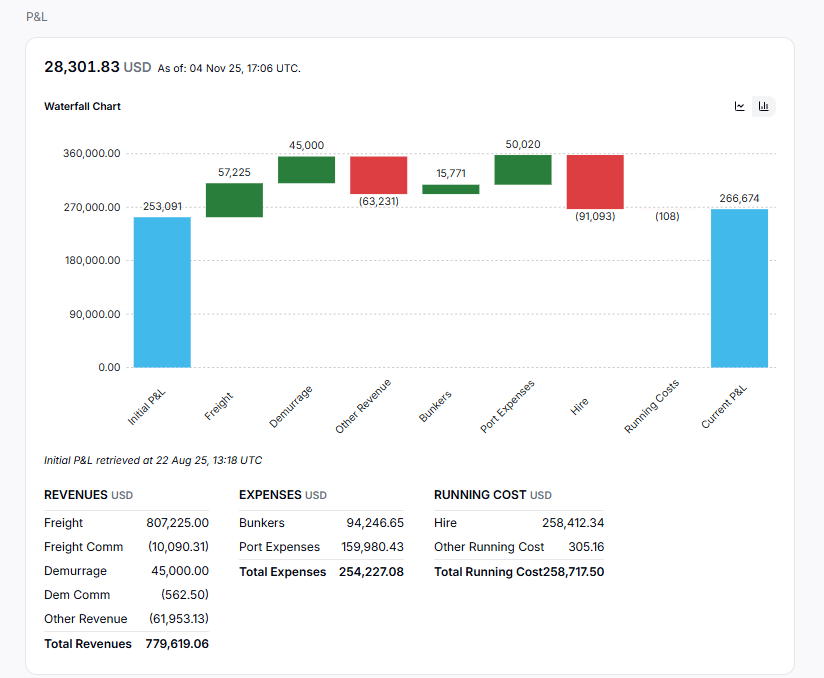
P&L trend charts
The P&L section also includes trend views built from the platform's saved snapshots of this voyage over time: a Metric Over Time chart (TCE, P&L, revenues, expenses, day counts, and more) and a Waterfall chart bridging the initial P&L to the current P&L, plus a P&L Remarks block and a line-item breakdown.
Note on availability: The P&L panel and Variance Breakdown require your environment to be linked to IMOS and are not available on voyages shared to you. If IMOS is not linked, the panel shows the following message: P&L requires an IMOS environment to be linked.
Side panels
The voyage detail page has a side-panel rail: Attachments, P&L, Sharing (visible only on voyages you own, with the right permissions), and contextual Claim Details, Cargo Details, and Vessel Details panels.
FAQs
Is the Enhanced view a different system from IMOS?
No. It's a native view of your existing IMOS voyages, kept in sync automatically. IMOS remains your system of record, and structural edits route back to IMOS through forms.
Why don't I see the P&L panel?
The P&L panel requires your environment to be linked to IMOS, and it's not available on voyages a counterparty shared with you.
What is the Variance Breakdown comparing?
Whatever two P&L columns you put in the Compare and with selectors. By default it compares the original estimate with the current actual; you can also compare against a saved snapshot or a deviation estimate.