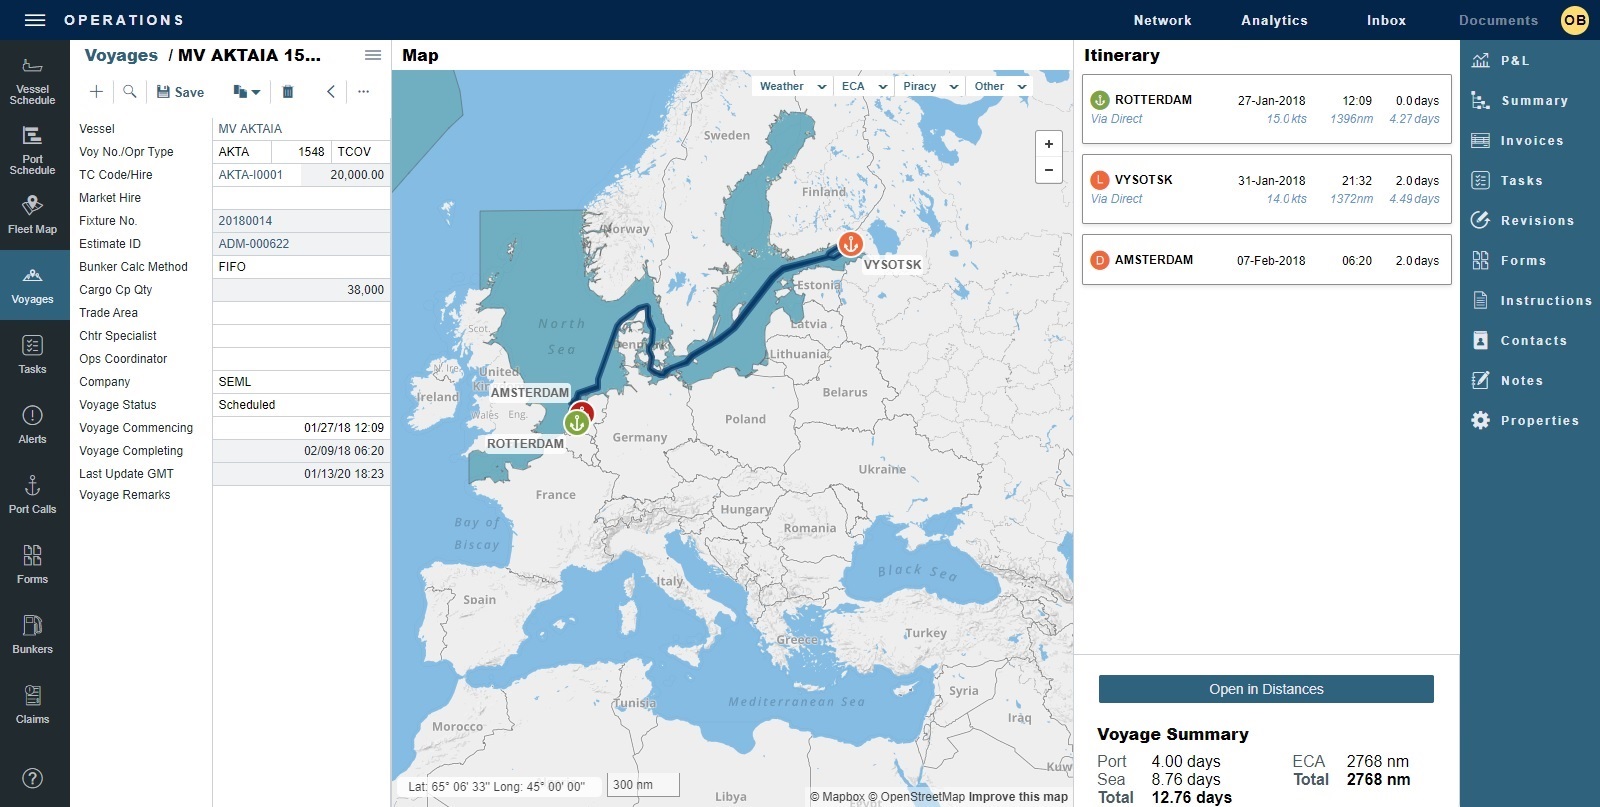
In Matching, Estimates, Voyages, and Forms workspaces, you can view your shipping data on a dynamic map. Fleet Map and Distances appear in the map view only.
To access a map, do one of the following:
-
In the top right corner of a workspace, click

-
When a workspace panel is expanded on the Voyage Manager, to the right of the voyage heading, click

You can do any of the following:
-
Select a different view.
-
Select areas to highlight with overlays.
-
On Estimates, Voyages, and Distances, minimize routing for ECA and Piracy zones.
-
Zoom in or out:
-
In the top right corner, click + or −.
-
While hovering over the map, scroll up or down.
-
-
Click and drag to view a different area of the map.
-
In the bottom left corner, view:
-
Latitude and longitude of your mouse pointer on the map
-
Distance scale
-
Map Views
To change the look of the map, hover over Other and then select one of the following views:
|
Default 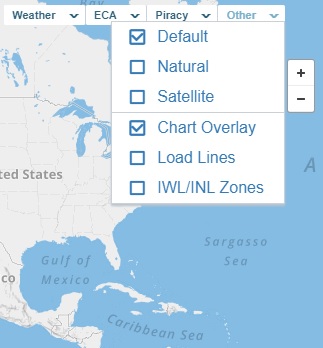
|
Natural 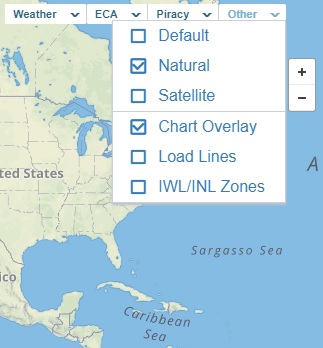
|
|
Satellite 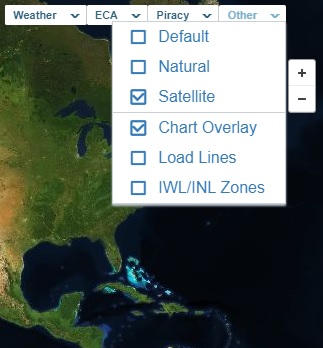
|
|
Map Overlays
Weather
You can use weather information to make decisions about itineraries and compare live weather data with reported information.
-
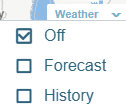
Hover over Weather and then select either Forecast (4 days) or History (10 days).
The weather control appears in the lower right corner of the map.
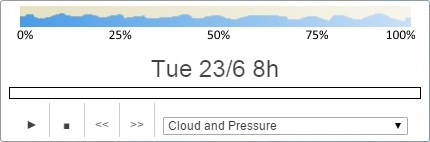
It includes:-
Key to the data in the overlay
-
Date and time being displayed
-
Timeline
-
Controls; click to:
-

Play
-

Stop
-

Step Back
-

Step Forward
-
-
-
Select the data type:
|
Cloud and Pressure 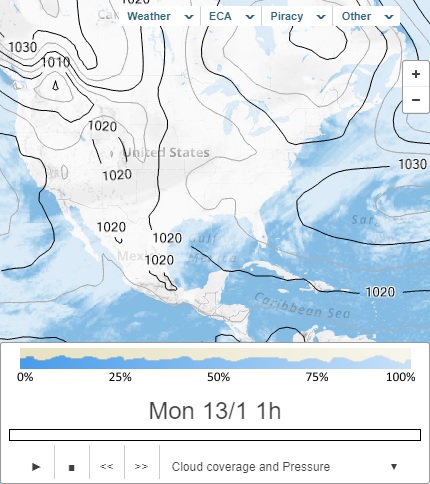
|
Precipitation and Pressure 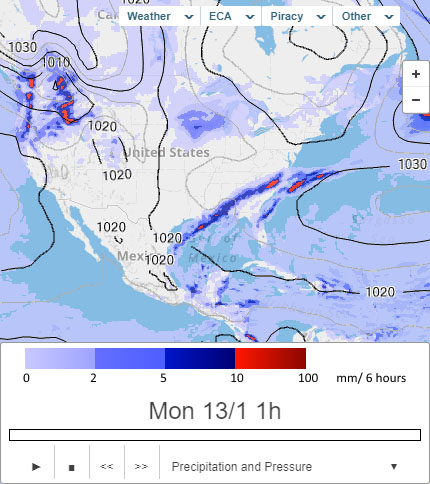
|
|
Temperature 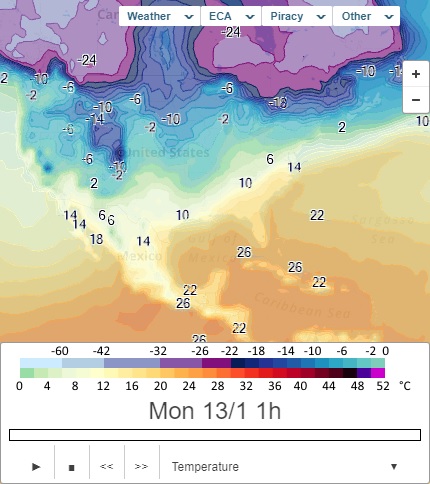
|
Wind 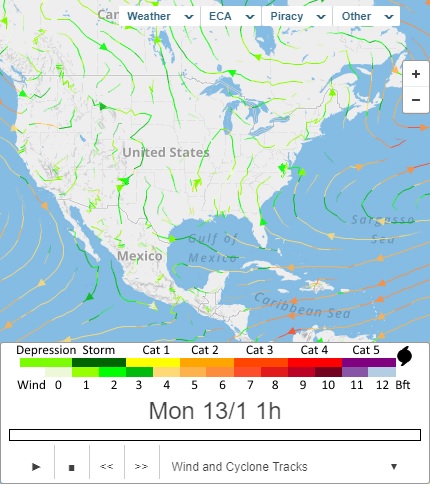
|
|
Sea Temperature and Ice Concentration 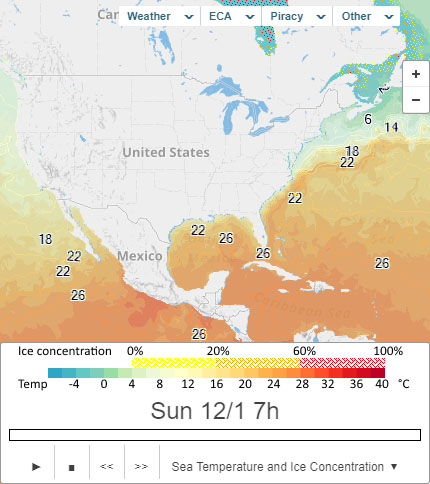
|
Ocean Current 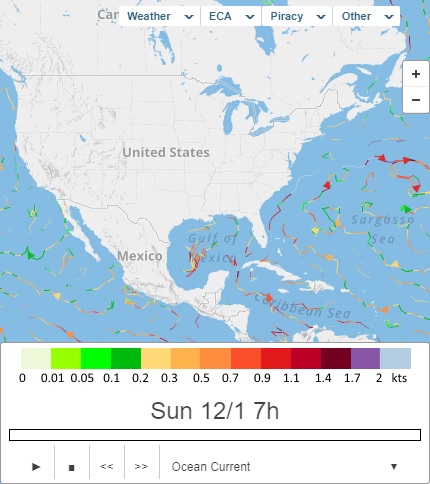
|
|
Sea State and Swell 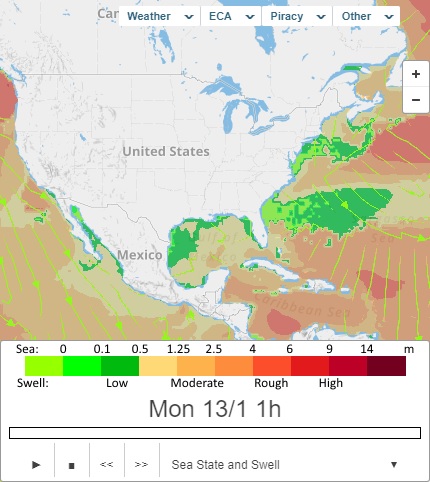
|
Sea State and Wind 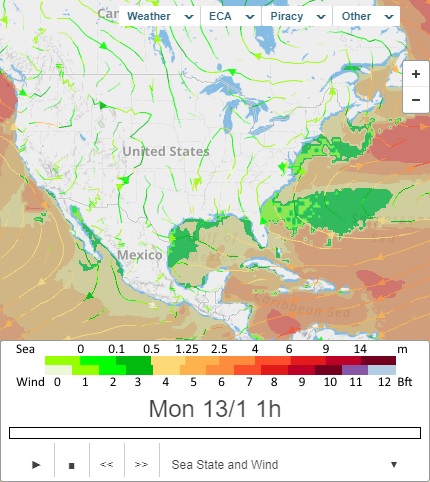
|
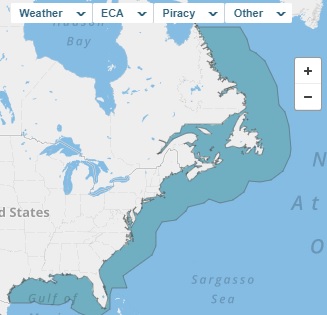
ECA Zones
To highlight one or more Emission Control Areas on the map, hover over ECA and then select one or more zones.
To minimize the distance in the selected ECA Zones for Estimates, Voyages, and Distances, click Minimize ECA Routing.
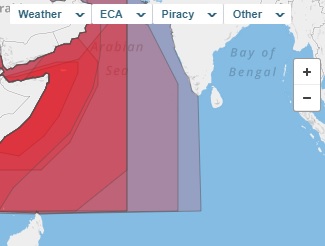
Piracy Zones
To highlight one or more Piracy Zones on the map, hover over Piracy and then select one or more zones.
To minimize the distance in the selected Piracy Zones for Estimates, Voyages, and Distances, select Minimize Piracy Routing.
Charts
To view nautical charts on the map when zoomed in, hover over Other and then select Chart Overlay.
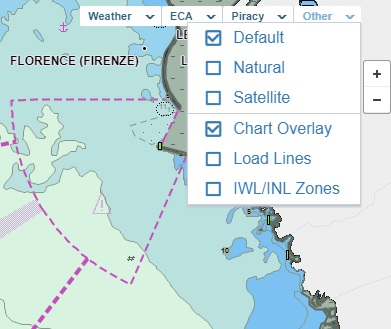
Load Lines
To highlight the load line zones on the map for draft calculations, hover over Other and then select Load Lines.
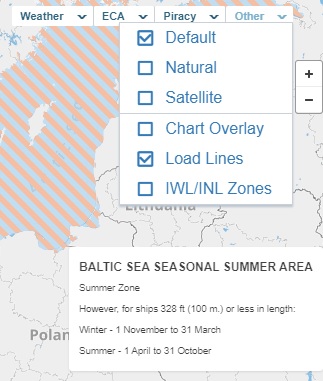
When you hover over the colored overlay for a load line zone, its description appears in the lower right corner of the map.
IWL/INL Zones
To highlight the IWL/INL insurance zones on the map, hover over Other and then select IWL/INL Zones.
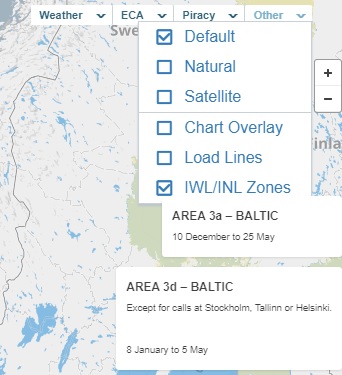
When you hover over the colored overlay for an IWL/INL zone, its description appears in the lower right corner of the map.
Bunkerworld
Veson Nautical and Bunkerworld have partnered to provide Platform users with real-time, port-based bunker prices. To enable the Bunkerworld integration, you must have a Bunkerworld subscription.
To see bunker prices for a port, hover over the port on the map.
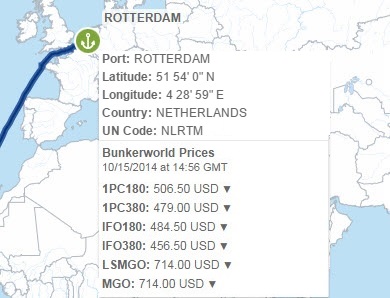
Integration features include:
-
Instant bunker quotes on the map, to inform pre-Fixture routes and mid-voyage deviations
-
Daily spot prices updated throughout the day
-
Support for all main fuel grades, including IFO, MDO, MGO, LS, and LSMGO
-
Price change indicators from the previous day to highlight recent price trends