Introduction
Fleet Database provides instant access to the wider market, allowing you to assess the health of the second-hand market. This information can be used for sales and purchases purposes, investigating potential investment opportunities, and privately viewing competitors' fleets.
Navigating to Fleet Database in Veson Platform
In the Veson Platform, go to VesselsValue in the sidebar menu.
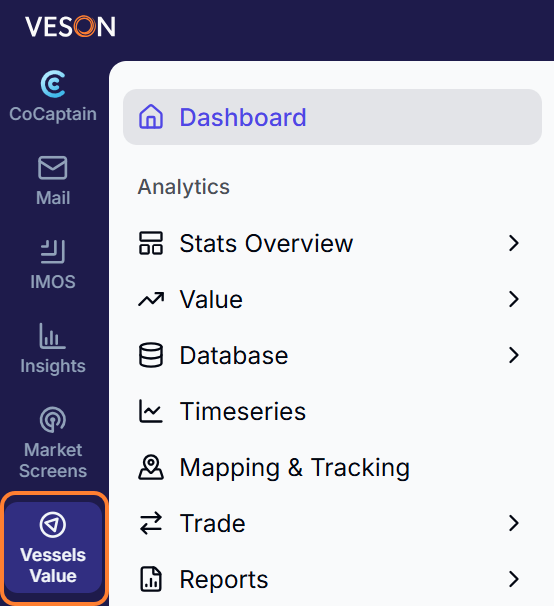
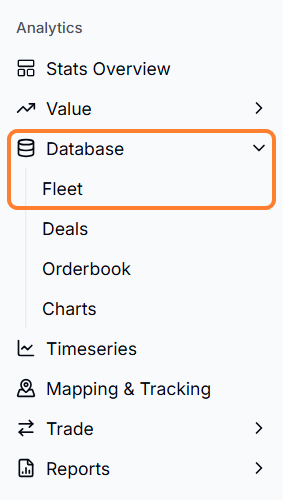
From the the main menu, select Database > Fleet.
Creating a Search Criteria
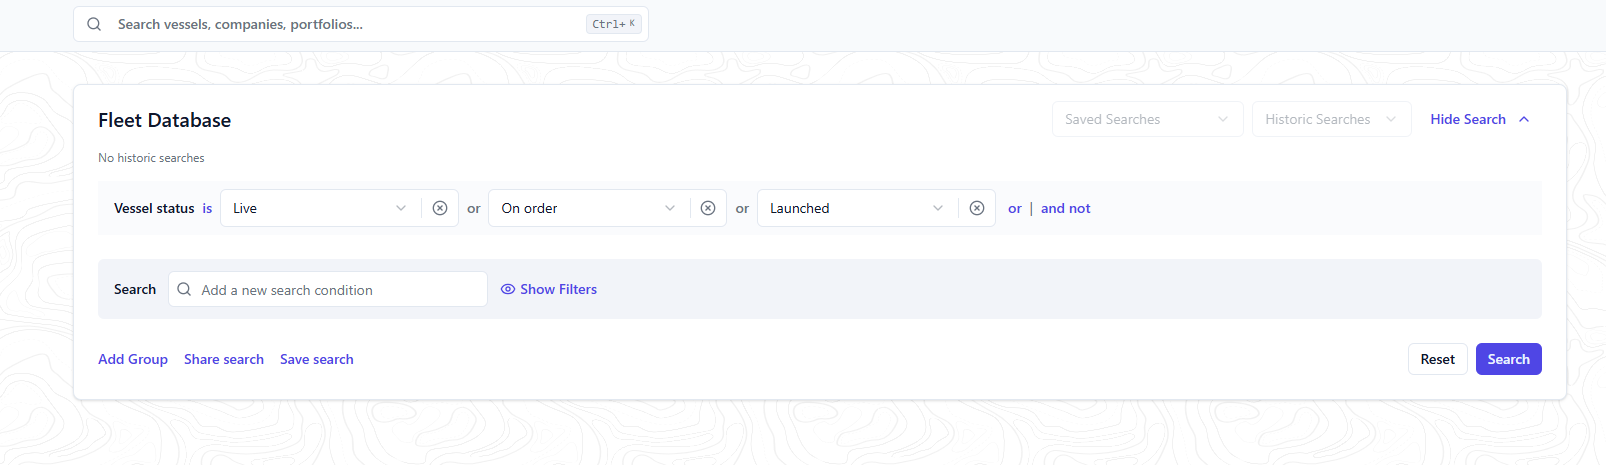
By default, the vessel status will be set to live, or on order, or launched. You can remove these conditions by selecting the X next to each one. To return to the default search, select the Reset button.
Adding New Conditions
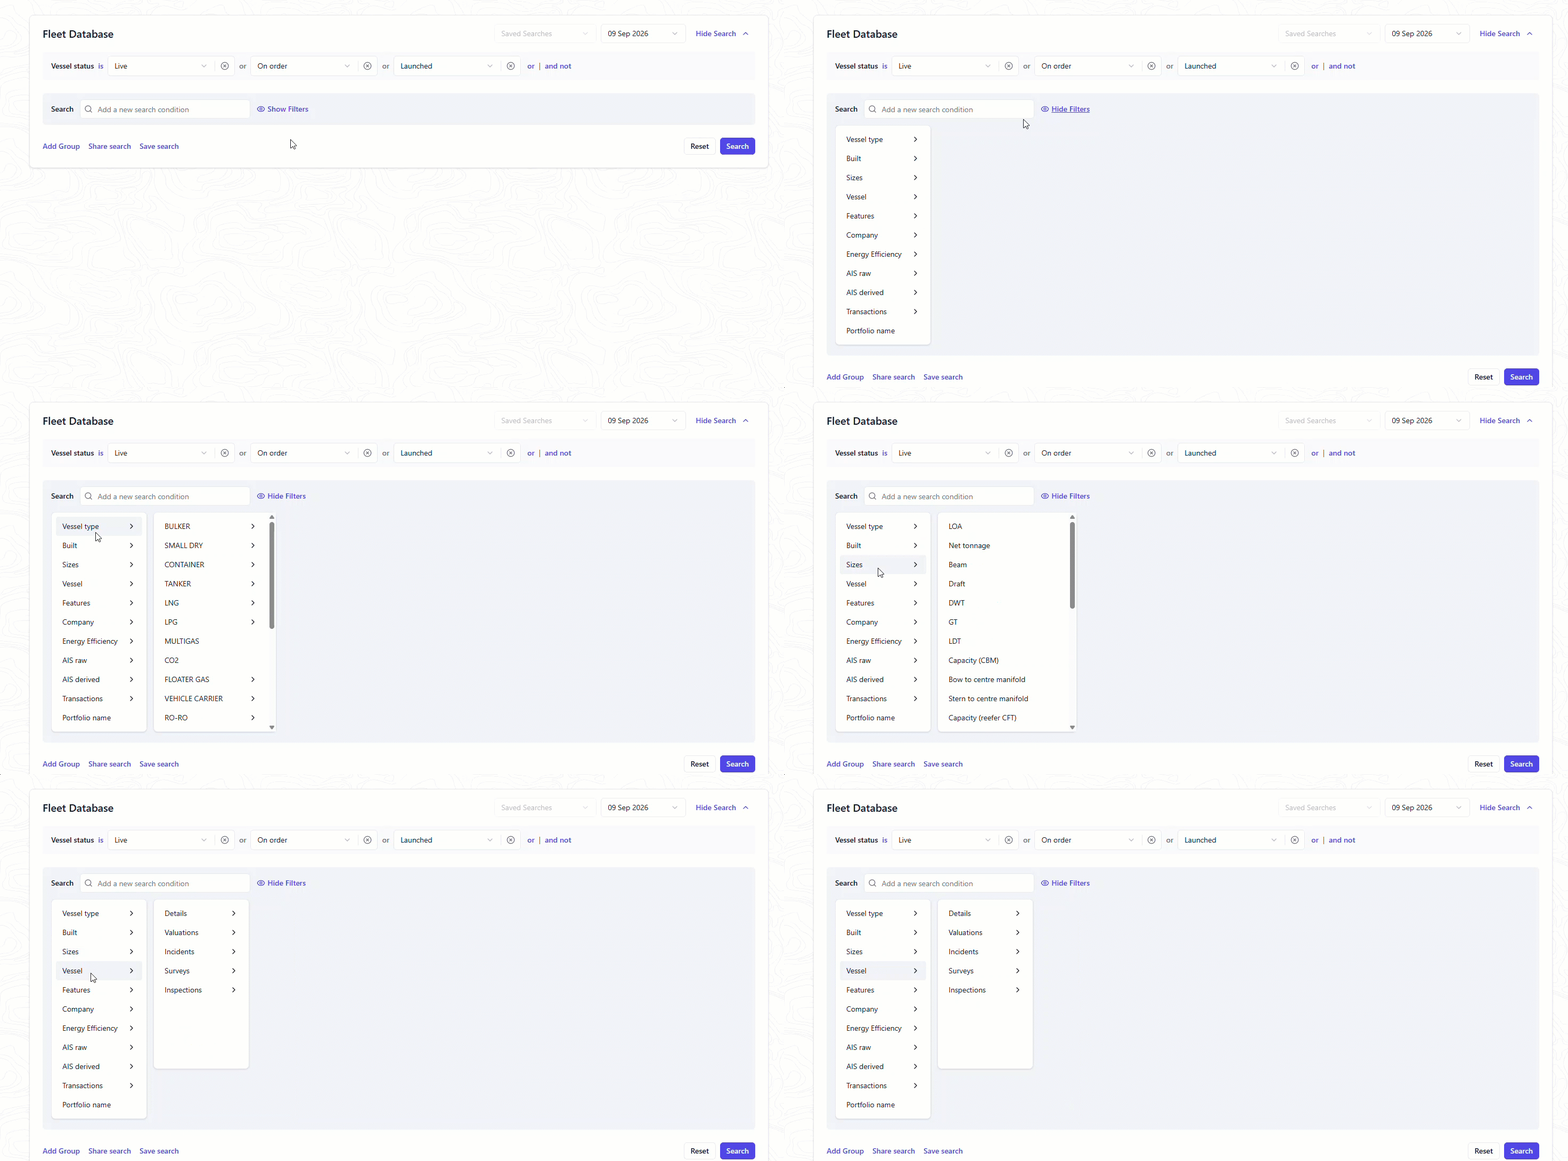
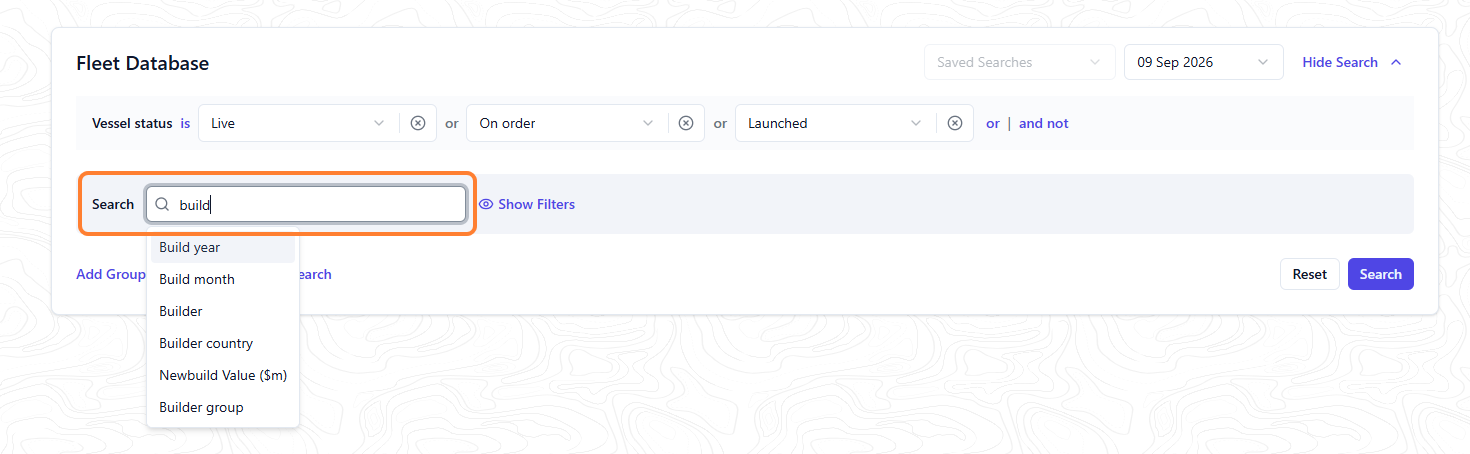
To add a new condition, you can either select from the dropdown list, or search for a condition in the search bar. To select from the dropdown list, select the 👁️ icon to show filters, and choose from the available options.
Viewing the Results
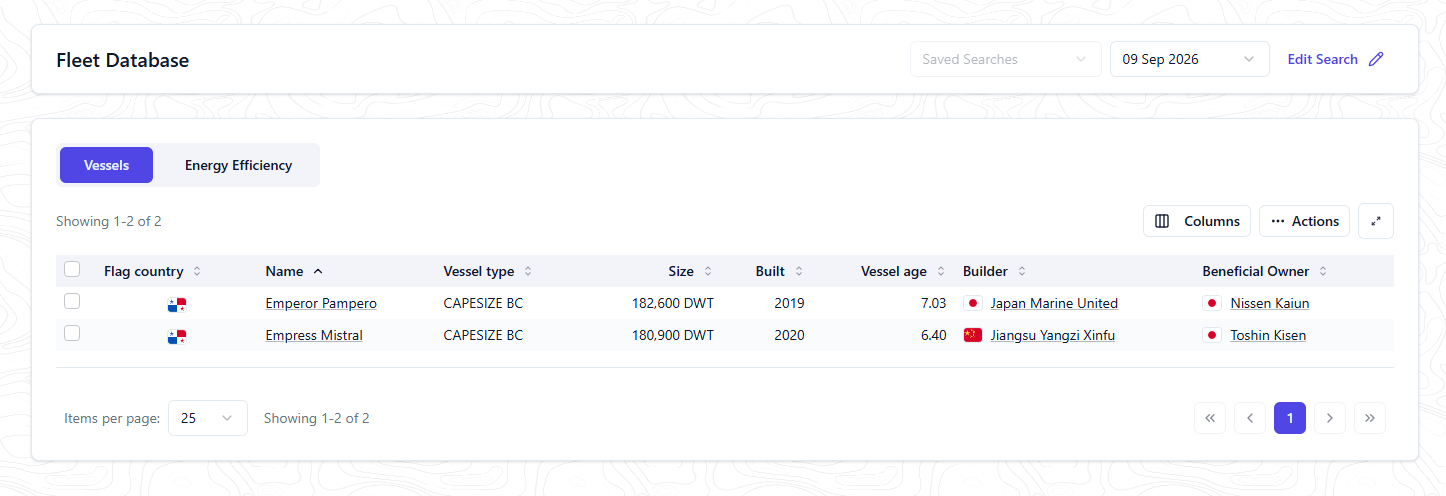
When performing a search, you will be shown the vessel results panel by default. The first time you use Fleet Database V2, the vessels results panel will be set to a default set of columns.
Sort columns
You can sort the columns by largest to smallest, or alphabetically, depending on the context. To sort a column, hover over the column name. The header table cell background will turn grey and an arrow will appear stating the order it will sort by.
Customizable Columns
You can change the columns of data being shown within the results tables using the Columns icon in the upper right.
Selecting the columns icon will trigger a pop-up containing the full range of columns available. You can then select the columns you would like to add. You can have up to a maximum of 12 columns i.e. 11 of your choice, plus vessel name. This is indicated on the bottom left with a count and will highlight red when the limit has been reached.
Vessel name is a mandatory column which you can’t remove since it’s a key column for navigating our website and our data.
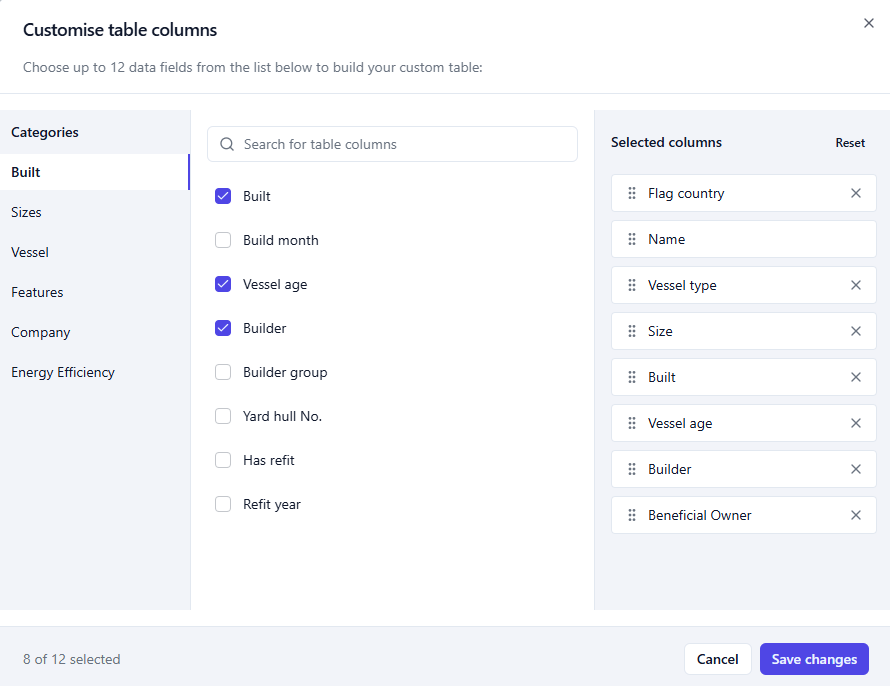
You must press save changes to close the pop-up, save your columns, and have them loaded in on the results table.
Any changes to your columns and number of rows selected will be remembered and becomes your default set of columns. To reset your table back to this default configuration, select Reset on the top right.
Exporting Results
You can export your results as an Excel spreadsheet by selecting Actions > Export and then select either a CSV or XLSX format.
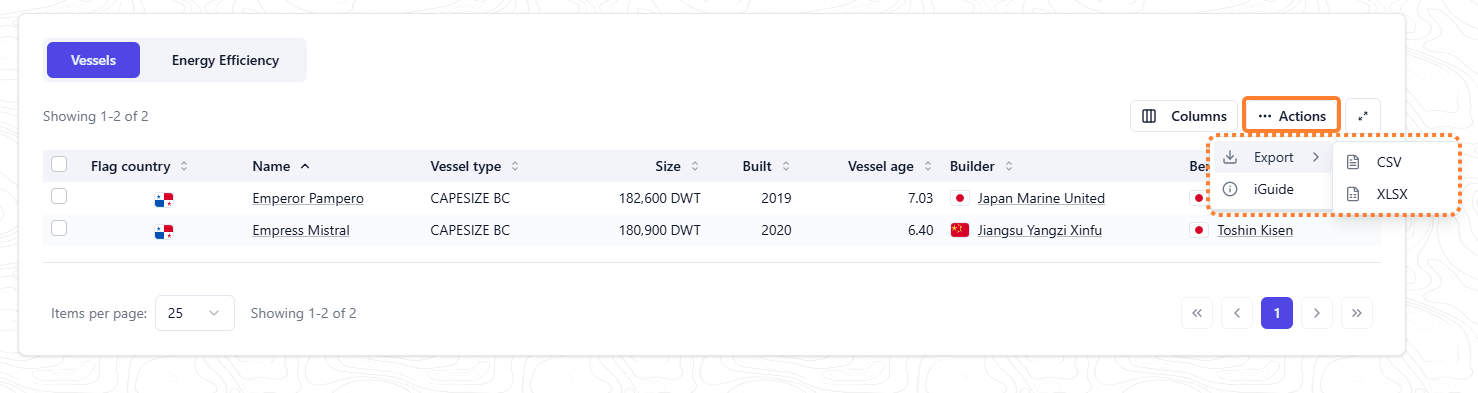
You will then be asked to accept our terms and conditions in a modal and then the file will download.
You can customize the data exported by changing the columns within the table. The order and columns you’ve chosen will be reflected in the exported spreadsheet. Exports are limited to the page and number of rows you’ve selected within the table.
The number of exports a user can do is determined by their permissions. The default is 10 per day.
Adding Vessels to Portfolio
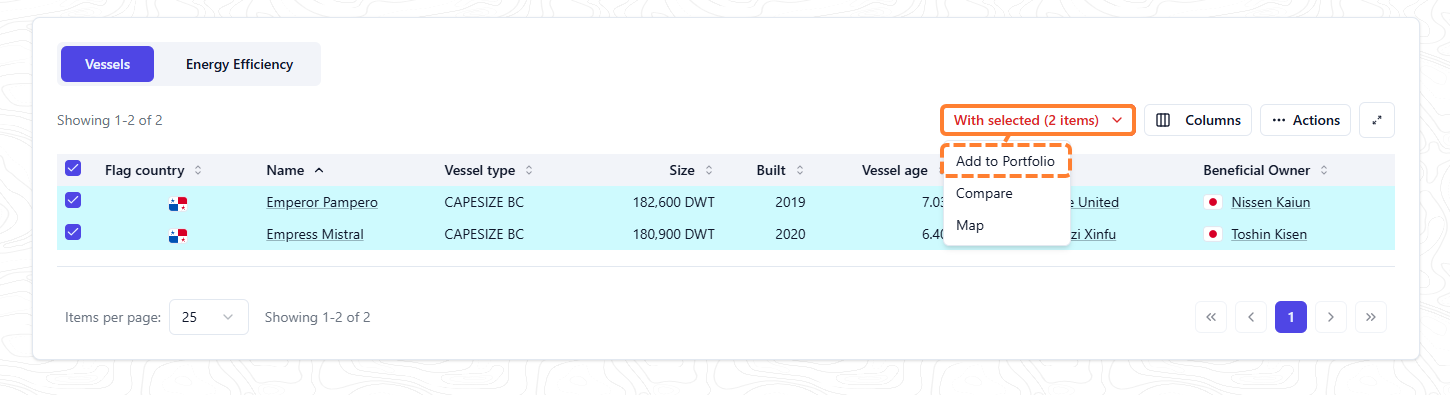
To add vessels to a portfolio, select the checkbox next to the vessel(s), select the With selected (X items) button and choose Add to portfolio from the dropdown list.
Existing portfolio
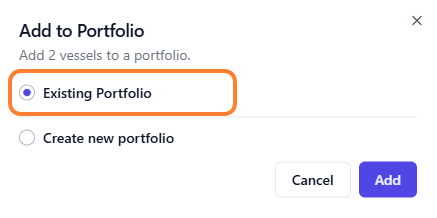
A pop-up will appear containing a list of your portfolios. Add the vessel(s) to an existing portfolio by selecting the radio button next to the portfolio name.
New portfolio
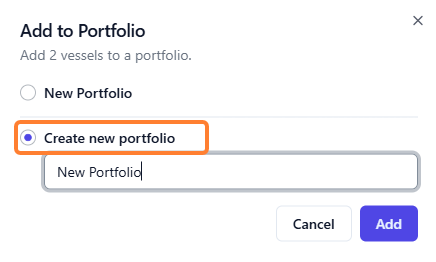
Or, you can select the Create new portfolio radio button and select Add to create a new portfolio to add the vessel(s) to.
Comparing Vessels
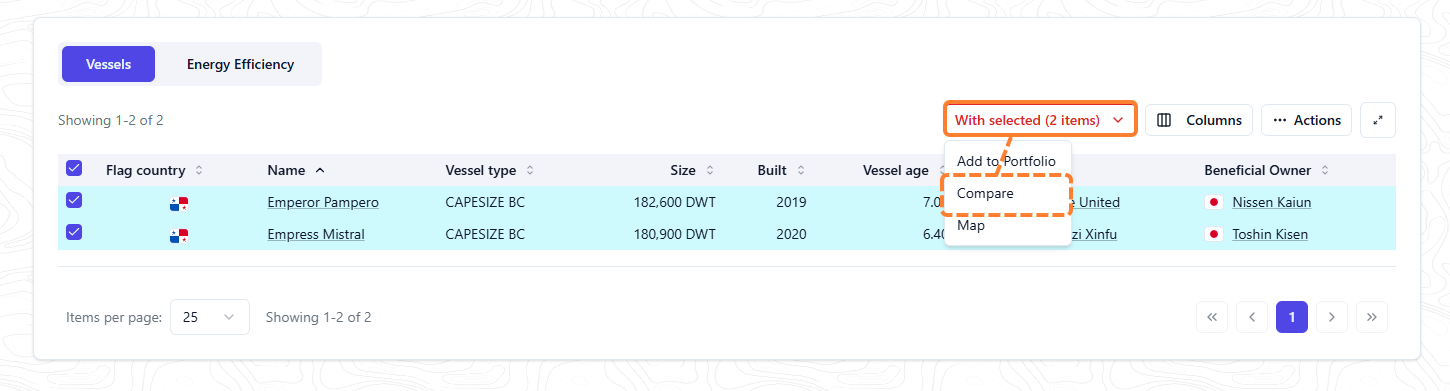
Another option is to compare vessels from your search results. To do this, select the vessels you would like to compare using the checkboxes in the first column. When a vessel is selected, its row will turn blue.
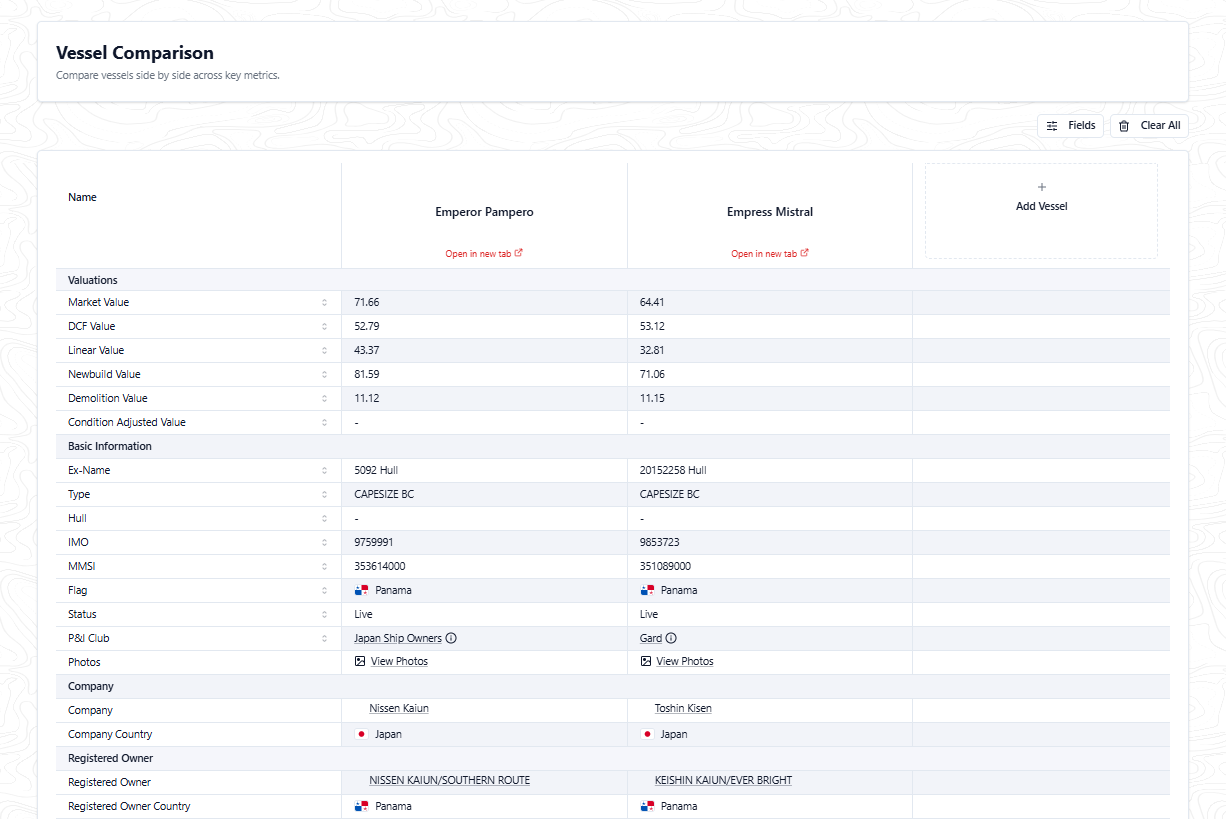
Once you have chosen the vessels to compare, select the Compare button. A new page will open containing a table of vessel particulars for the vessels you’ve chosen.
Viewing Vessels on the Map
You must have our Mapping module in order to use this functionality.
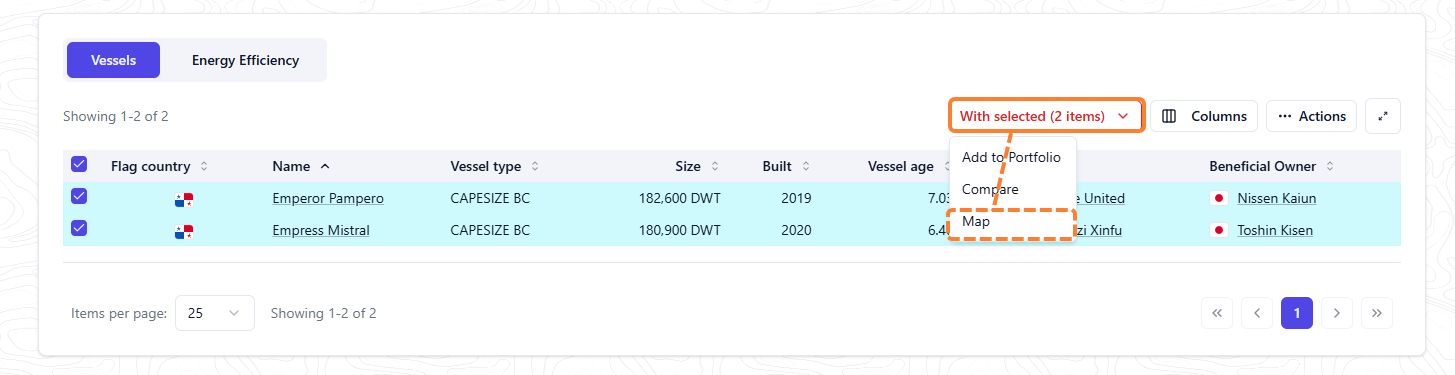
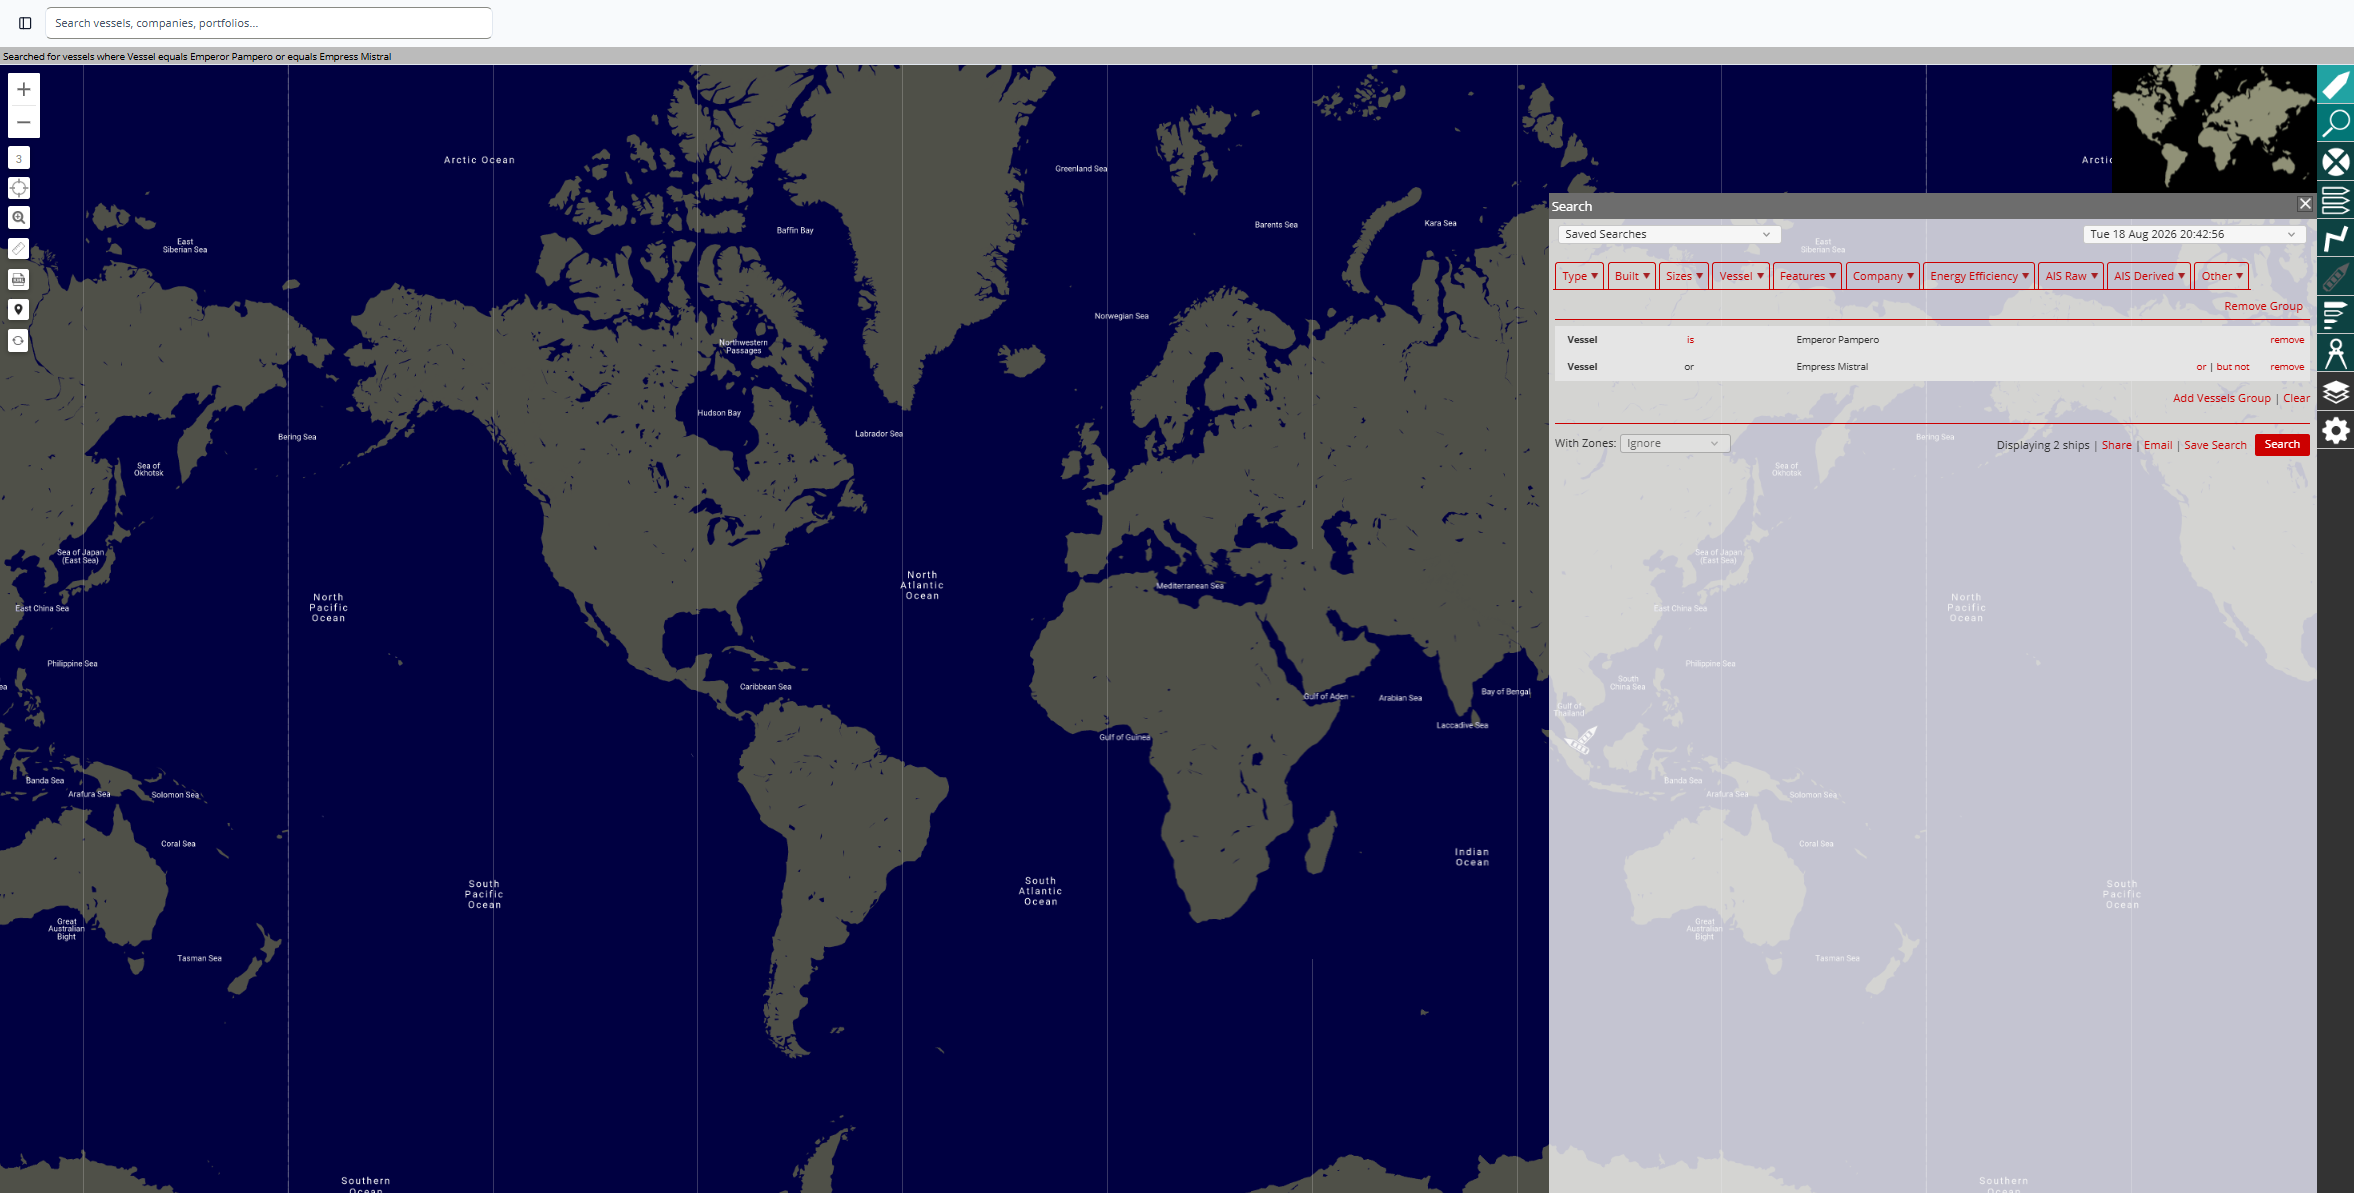
If you would like to view vessels on a map, select them from the list, click Actions and select Map from the dropdown list. This will open the Map view. Note, you must have our Mapping module in order to use this functionality.
Viewing Energy Efficiency Information
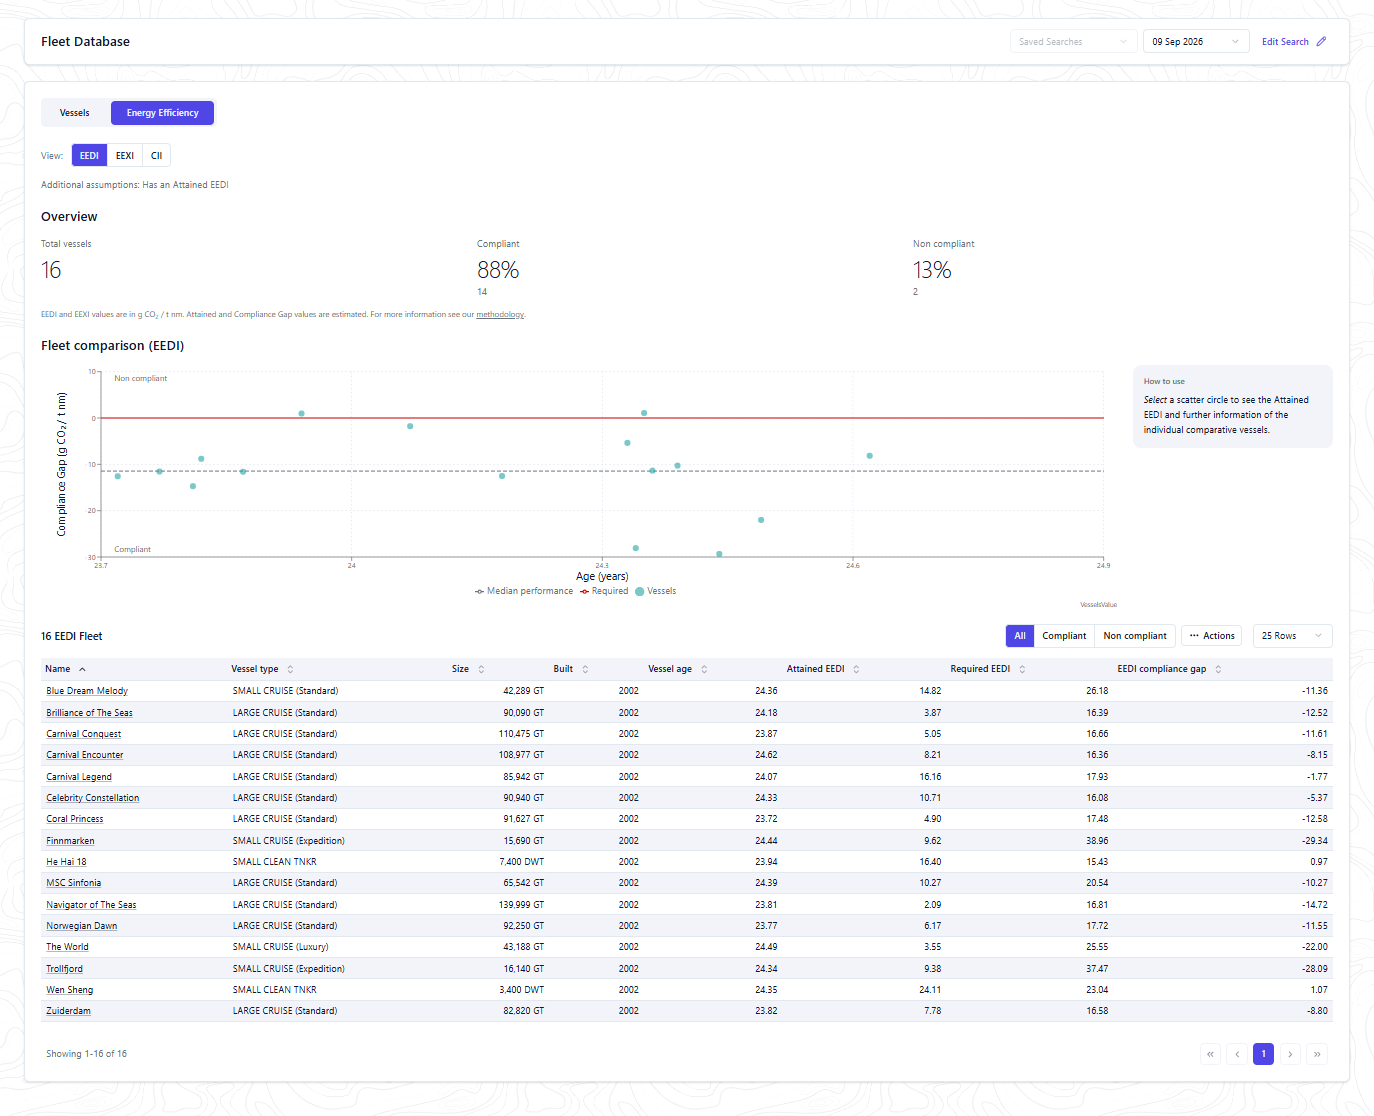
You also have the option to view the EEDI & EEXI information of your results. To view this information, navigate to the Energy Efficiency tab. From there, you can choose EEDI, EEXI, or CII. EEDI is the default view.
EEDI & EEXI
For both the EEDI and EEXI tabs, you’ll see a breakdown of all vessels by counts and percentages, a visual chart, and a table of results which you can filter by all, compliant, and non-compliant.
Note: When EEDI or EEXI are selected, the tabs make the assumption that all vessels have an Attained EEDI or EEXI. This is to show you the most relevant information.
Viewing CII Information
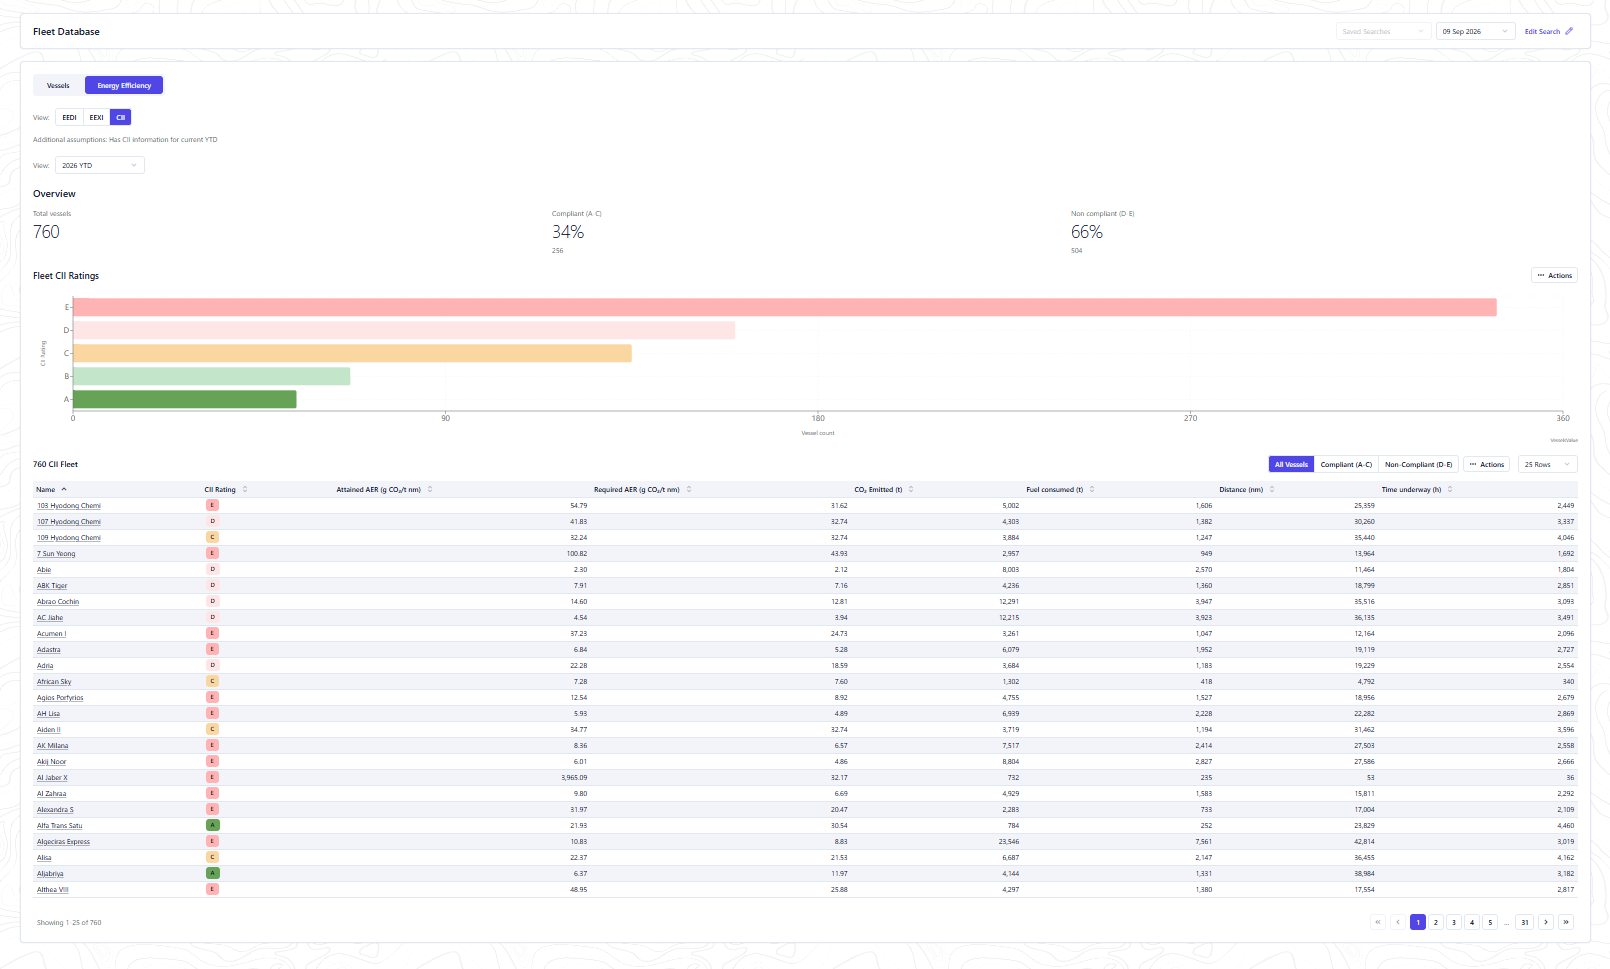
For the CII tab, you’ll see a breakdown of all vessels by counts and percentages, a visual chart, and a table of results which you can filter by all, compliant, and non-compliant.
You can also see the past 3 years of CII data by selecting from the view dropdown. The default is the current year to date i.e. 2024 YTD.
Note: When CII is selected, this tab makes the assumption that the vessel had CII information for the current year to date (YTD). This is to show you the most relevant information.