
The Inspection Heat Map is a geographic view of where inspection activity is concentrated across the fleet or market, useful for spotting regional patterns rather than per-vessel detail.
In the sidebar menu, go to Tools → Inspection Heat Map
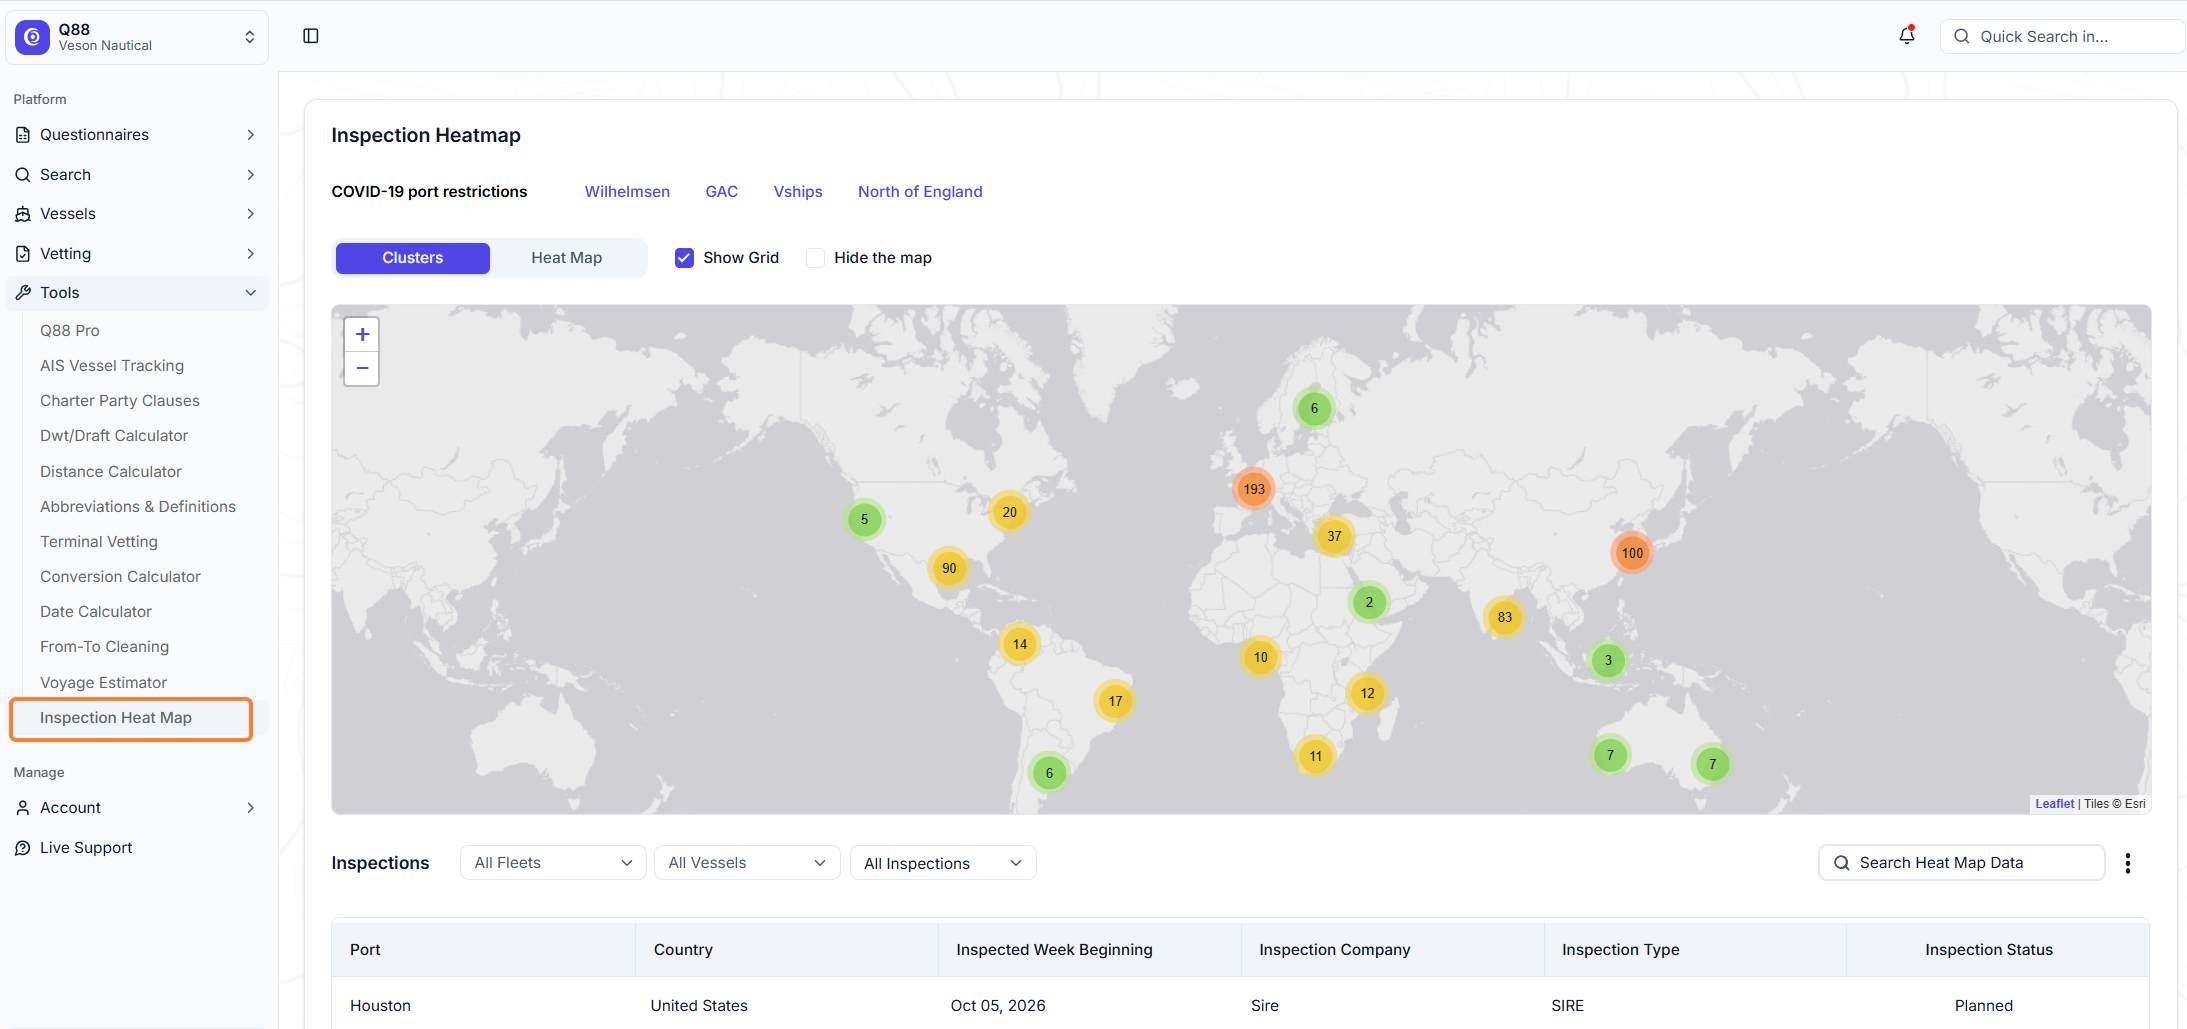
Cluster view
The map displays concentration areas — hovering or clicking an area shows the number of inspection activities recorded there (e.g., "193 activities in this area"). This is the default view.
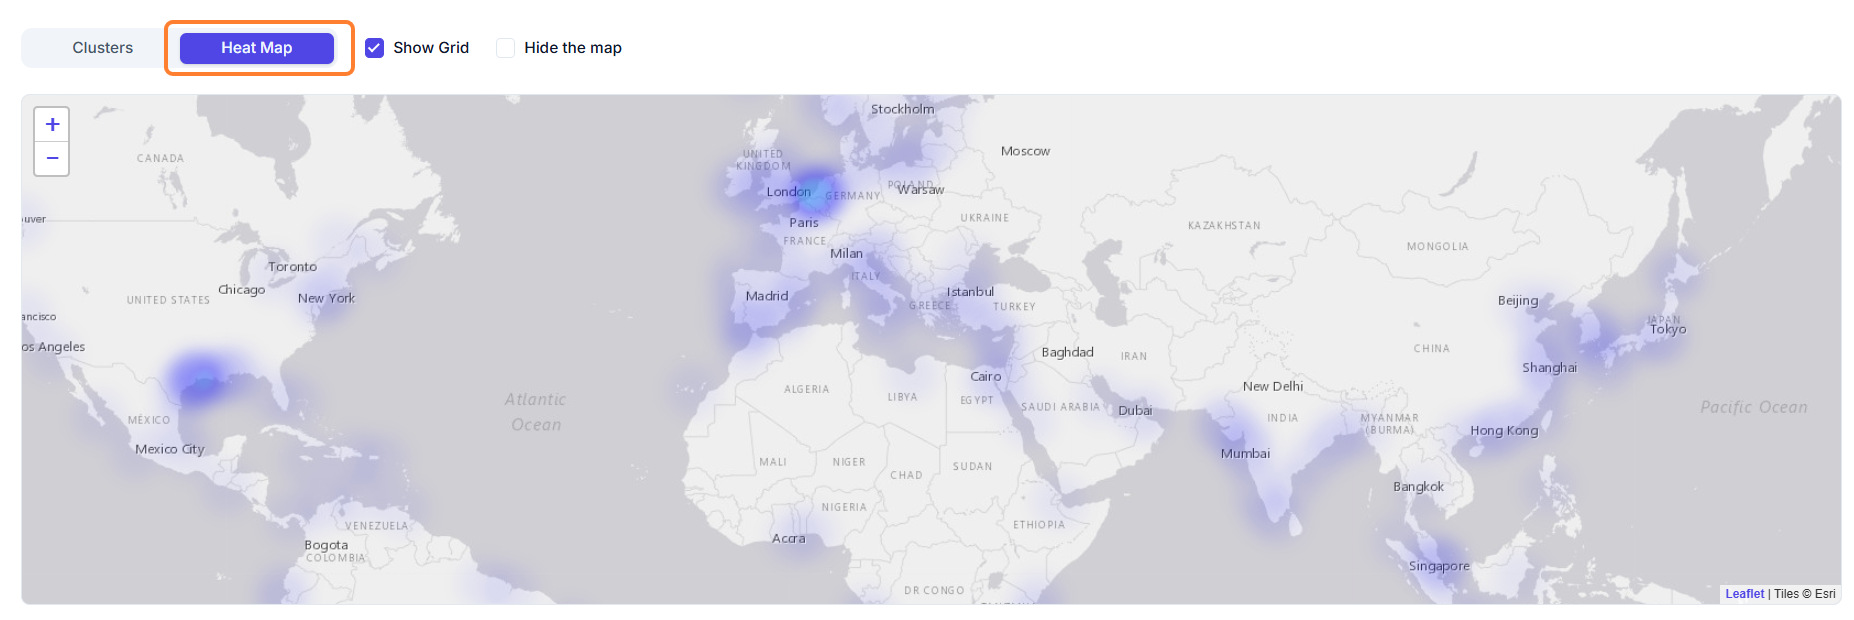
Heat Map
Use the Heat Map button to switch from numbered clusters to a color-gradient display, where concentration is shown by light/dark shading instead of a specific count.
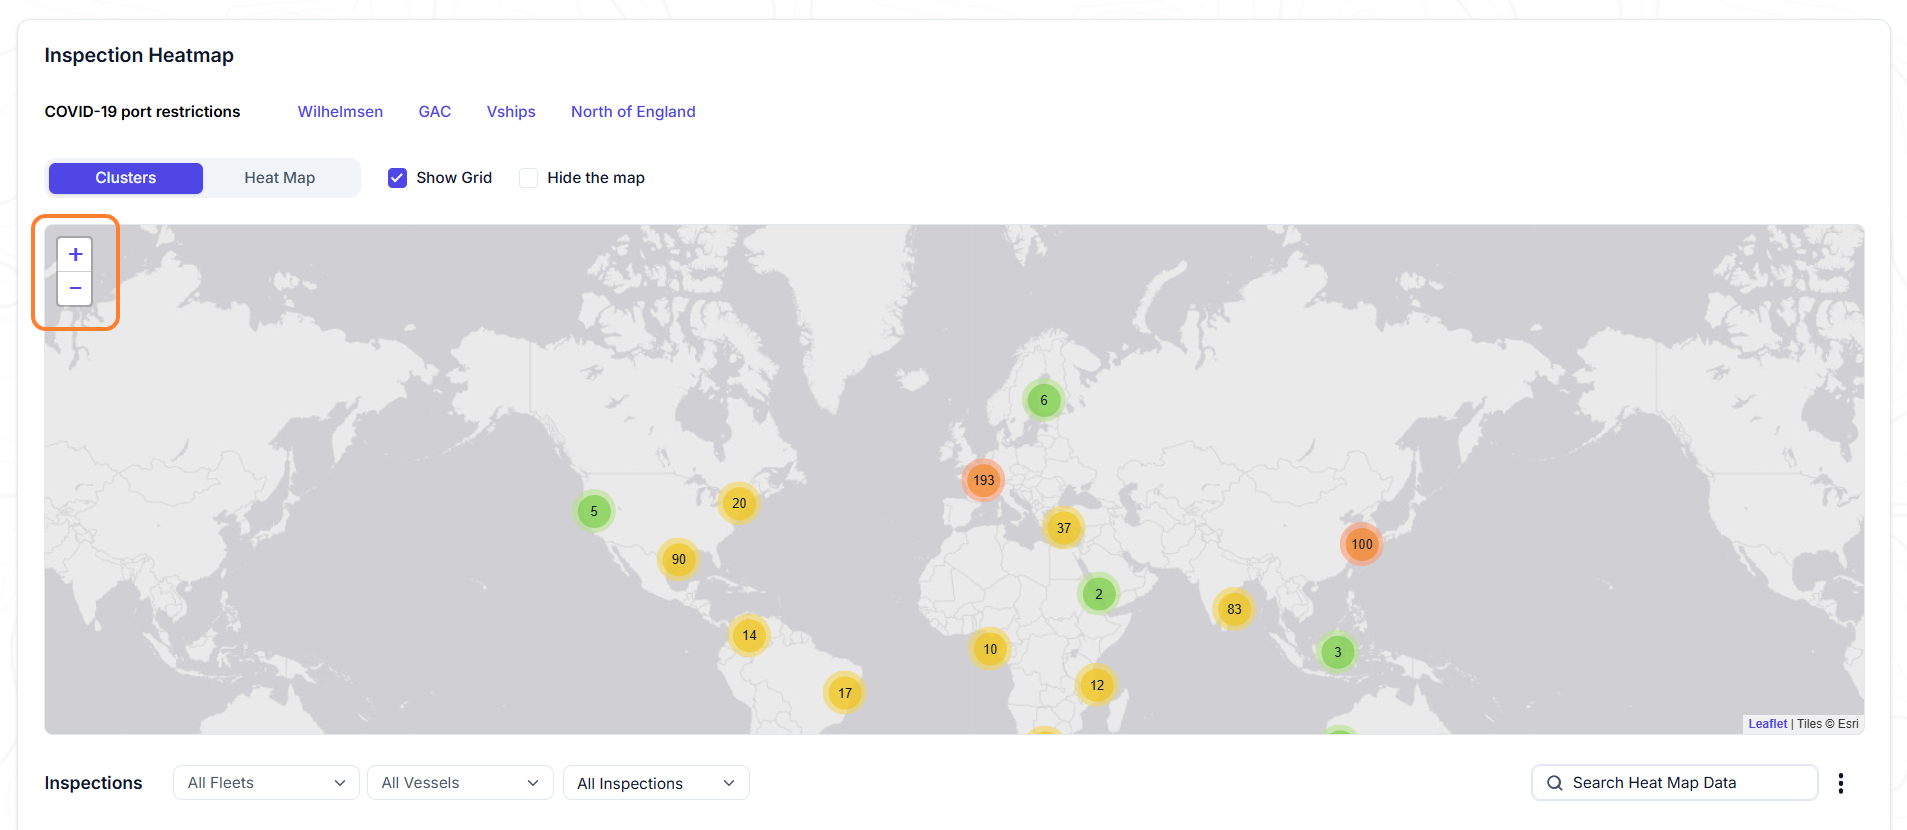
Explore a region
Scroll or zoom in to drill into a specific region.
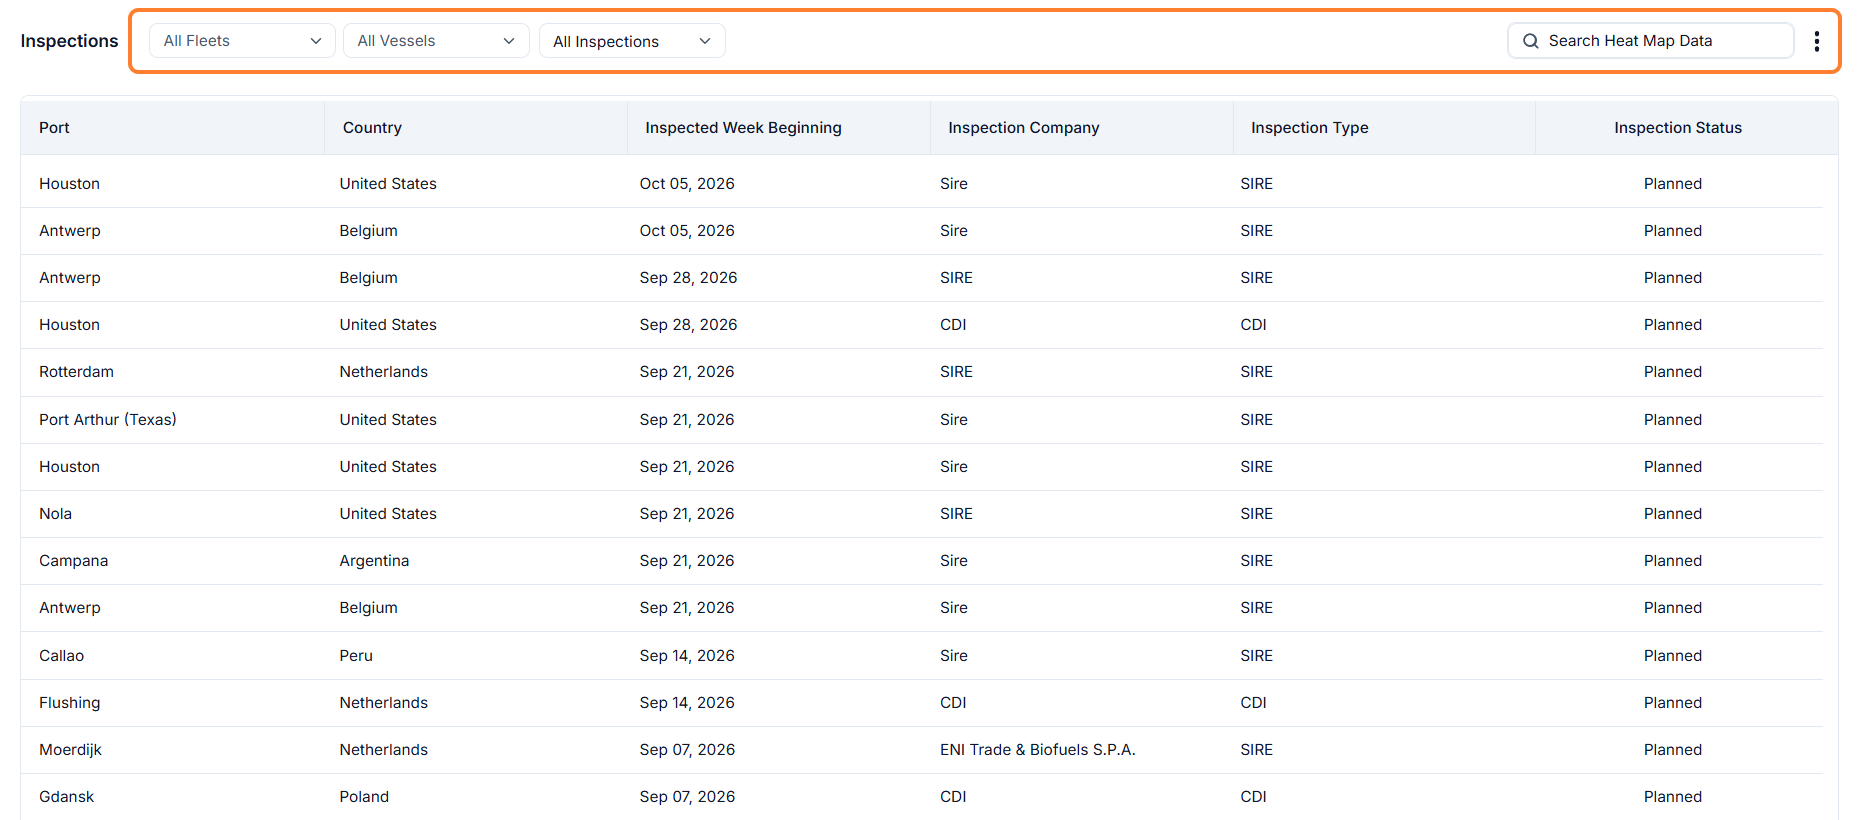
Breakdown table
Below the map, the breakdown of individual inspections making up that concentration is available for detail-level review. Use the filters and search bar to narrow your search.
Refresh or Reset Data
Use the three-dot menu in the upper right to refresh the data or reset your view.
