Note: This feature is only available to premium subscribers only.
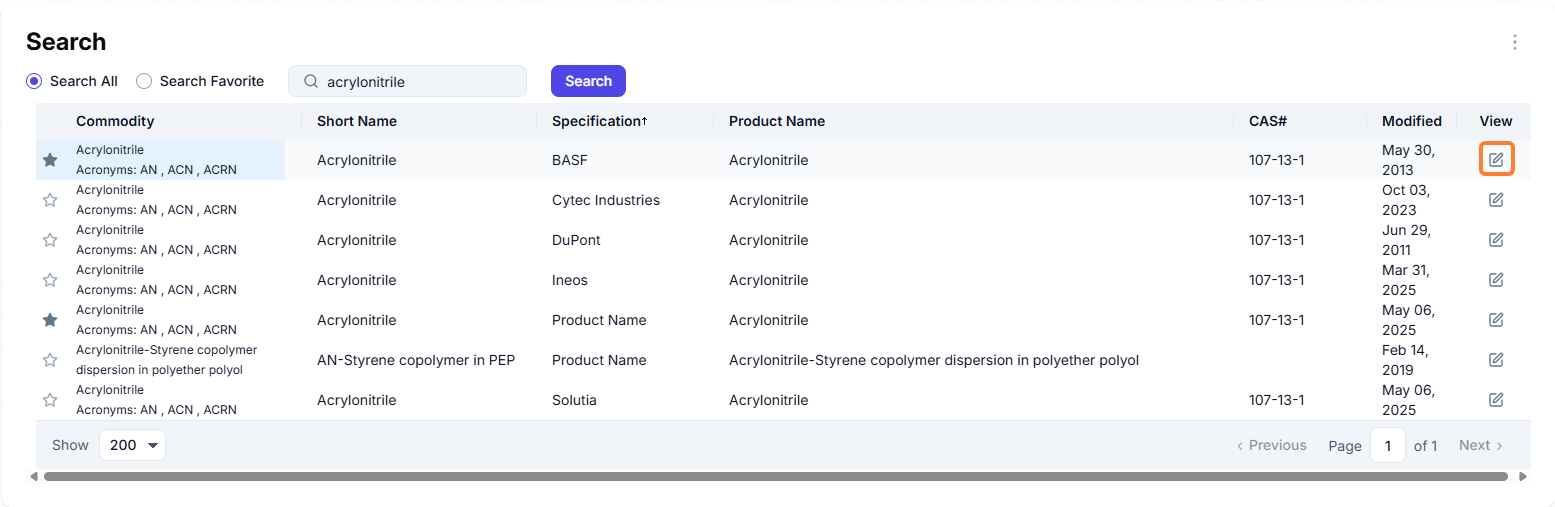
The UV Graphs section in VMS displays products with UV graphs for use with a spectrometer. To access the UV graph for a specific commodity, navigate to the Commodities module → Search, use the search box to search for the specific commodity and select the View icon to see the specification form for that product.
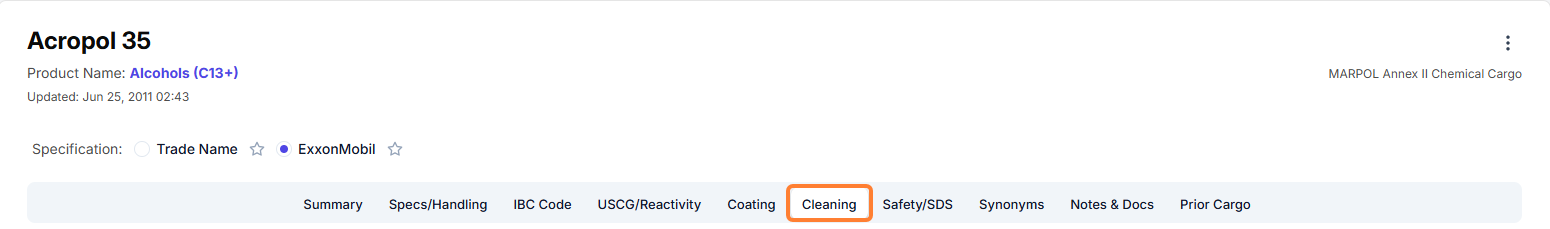
Navigate to the Cleaning tab.
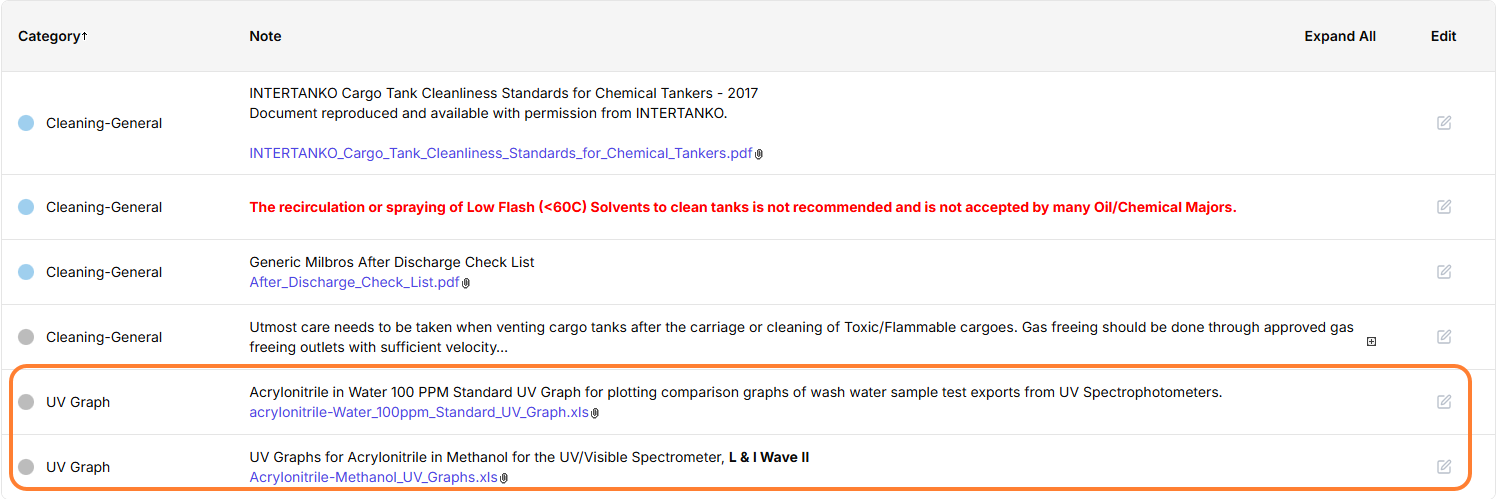
At the bottom of the cleaning tab there will be UV graph category with an Excel attachment.
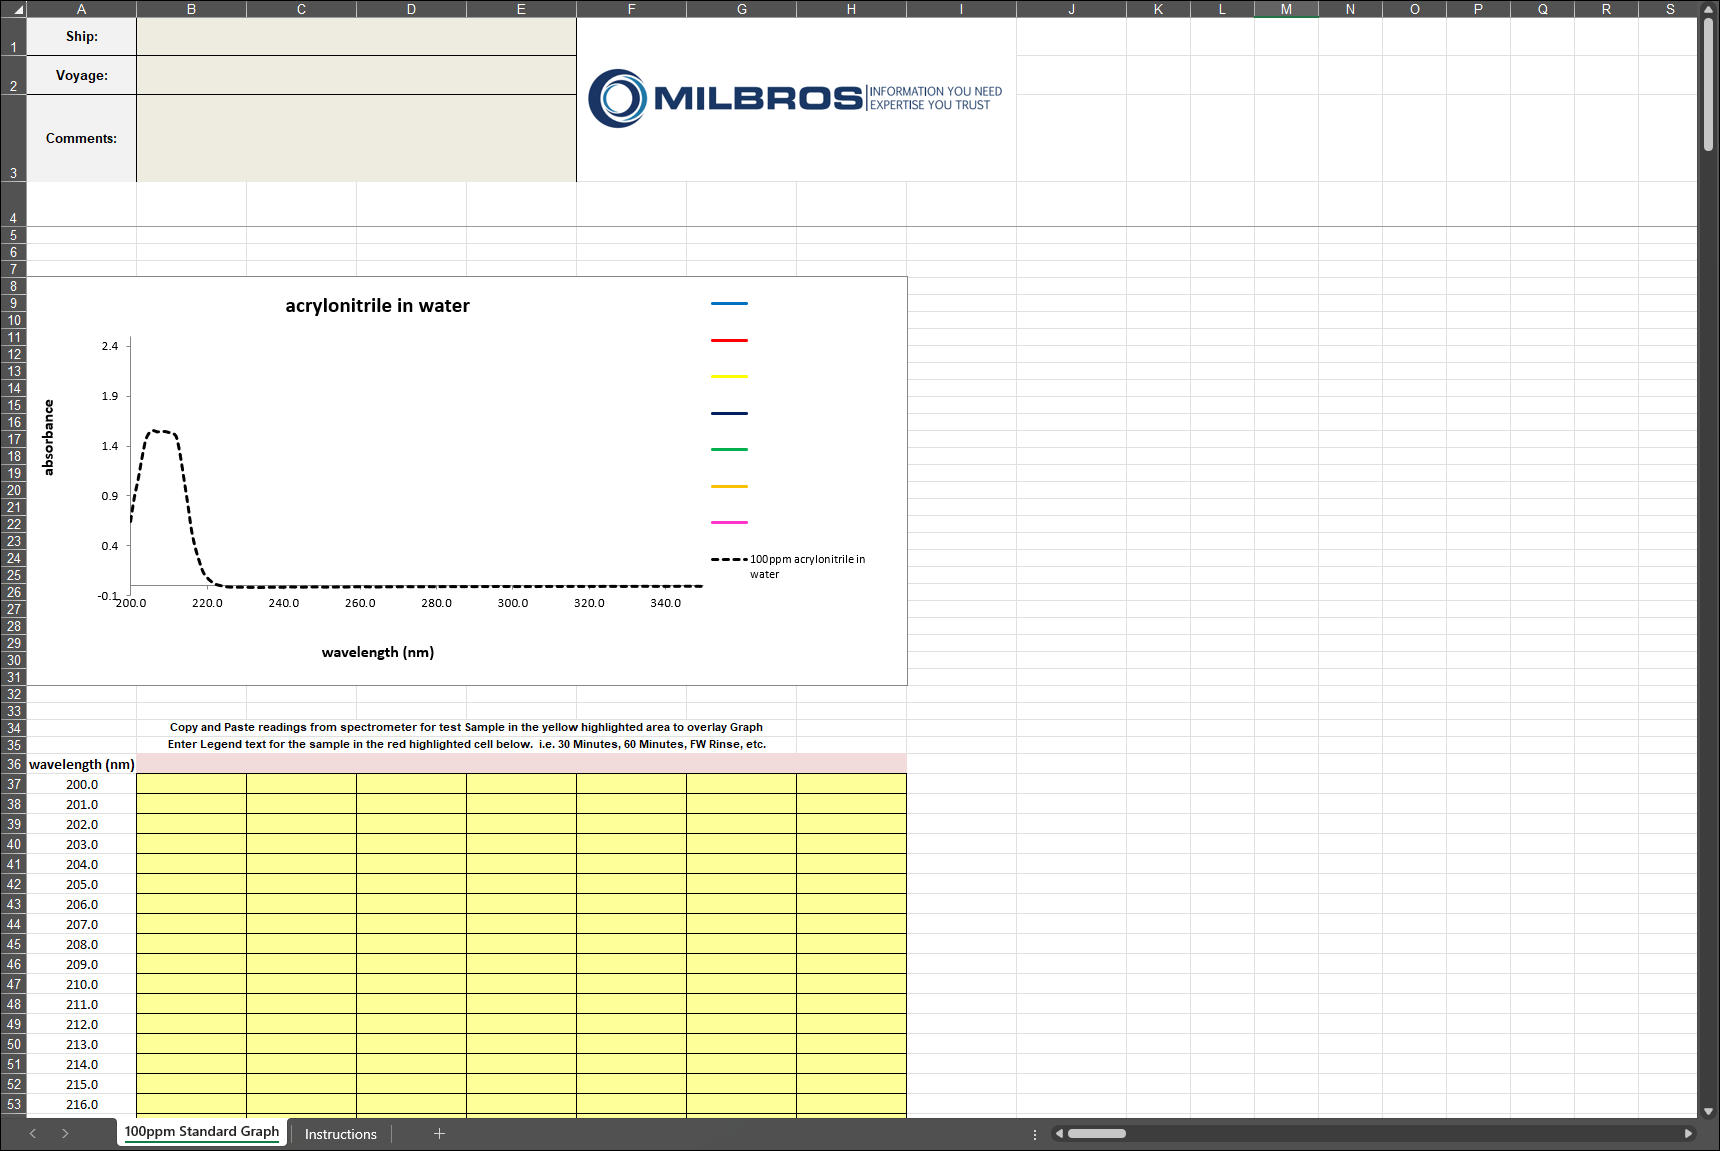
The graph looks like the example below. Enter the spectrometer readings in this Excel sheet.